


Test Methodology
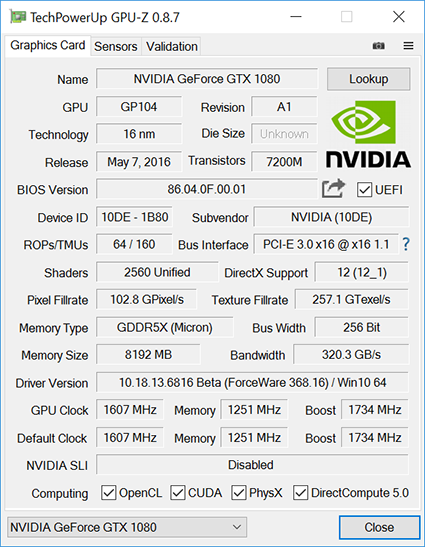
Nvidia GeForce GTX 1080 Specification |
|---|
 |
GPU Comparisons |
||||||||
|---|---|---|---|---|---|---|---|---|
| Graphics Card | GPU Cores | Base Clock (MHz) |
Boost Clock (MHz) |
Memory Size (MB) |
Memory Clock (MHz) |
Memory Bus (bits) |
Graphics Driver | |
| Nvidia GeForce GTX 1080 | 2,560 | 1,607 | 1,734 | 8,192 | 10,000 | 256 | 368.16 | |
| Nvidia GeForce GTX Titan X | 3,072 | 1,000 | 1,076 | 12,228 | 7,010 | 384 | 368.16 | |
| Nvidia GeForce GTX 980 Ti | 2,816 | 1,000 | 1,076 | 6,144 | 7,010 | 384 | 368.16 | |
| Nvidia GeForce GTX 980 | 2,048 | 1,127 | 1,216 | 4,096 | 7,010 | 256 | 368.16 | |
| Nvidia GeForce GTX 780 Ti | 2,880 | 875 | 928 | 3,072 | 6,008 | 384 | 368.16 | |
| Nvidia GeForce GTX 680 | 1,536 | 1,006 | 1,058 | 2,048 | 6,008 | 256 | 368.16 | |
| AMD Radeon R9 Fury X | 4,096 | 1,050 | NA | 4,096 | 1,000 | 4,096 | 16.5.2 | |
| Sapphire Radeon R9 390X | 2,816 | 1,050 | NA | 8,192 | 6,000 | 512 | 16.5.2 | |
| Sapphire Radeon R9 390 | 2,560 | 1,010 | NA | 8,192 | 6,000 | 512 | 16.5.2 | |
HEXUS Graphics Test Bench |
|
|---|---|
| Hardware Components | |
| Processor | Intel Core i7-6700K (overclocked up to 4.40GHz) |
| CPU Cooler | Noctua NH-D15 (single fan) |
| Motherboard | Gigabyte Z170XP SLI |
| Memory | Crucial Ballistix Sport LT 16GB (2x8GB) DDR4-2400 |
| Power Supply | be quiet! Dark Power Pro 11 850W |
| Storage Device | 512GB SK hynix Canvas SC300 |
| Chassis | Corsair Graphite Series 600T |
| Monitor | Philips Brilliance 4K Ultra HD LED (288P6LJEB/00) |
| Operating system | Windows 10 (64-bit) |
Benchmark Suite |
|
|---|---|
| Synthetic Benchmarks | |
| 3DMark | Fire Strike, Fire Strike Extreme and Fire Strike Ultra |
| Gaming Benchmarks | |
| Fallout 4 | Ultra quality preset at various resolutions. |
| Rise of the Tomb Raider | Very high quality settings, DX12 at various resolutions. |
| Star Wars Battlefront | Ultra quality settings at various resolutions. |
| Tom Clancy's The Division | Ultra quality settings at various resolutions. |
| General Benchmarks | |
| Power Consumption | To emulate real-world usage scenarios, we record system-wide mains power draw both when idle and while playing Star Wars Battlefront. |
| Temperature | To emulate real-world usage scenarios, we record GPU core temperature both when idle and while playing Star Wars Battlefront. |
| Noise | A PCE-318 meter is used to record noise levels when idle and while playing Star Wars Battlefront. |
| Overclocking | Maintaining out-the-box voltage, we increase the card's power target and aim for an optimal balance of core and memory overclock. With the heightened frequencies in place, the 3DMark, Rise of the Tomb Raider and Tom Clancy's The Division tests are re-run at 4K UHD settings. |
Notes
To minimise the impact of any CPU bottlenecks, our test platform is configured with a quad-core Intel Core i7-6700K processor overclocked at up to 4.4GHz and 16GB of Crucial Ballistix Sport LT DDR4 memory set to run at 2,400MHz.
For our high-end benchmark suite, we have an array of games tested at FHD (1,920x1,080), QHD (2,560x1,440) and 4K UHD (3,840x2,160) resolutions. Where applicable, any vendor-specific enhancements such as PhysX and TressFX are disabled to help even the playing field. In-game benchmark results are recorded as minimum and average frames per second.
We felt it important to include previous generations of Nvidia hardware. Ignoring price for the moment, the architecture-to-architecture comparisons are most keen between the GTX 1080 and GTX 980 and GTX 680, the latter of which used relatively small dies and were the first gaming-focussed cards from the Maxwell and Kepler generations. Let's find out how much progress Nvidia has made in four years - GTX 680 to GTX 1080.


