


Test Methodology
Gigabyte GTX 980 Ti WaterForce Specification |
|---|
 |
GPU Comparisons |
||||||||
|---|---|---|---|---|---|---|---|---|
| Graphics Card | GPU Cores | Base Clock (MHz) |
Boost Clock (MHz) |
Memory Size (MB) |
Memory Clock (MHz) |
Memory Bus (bits) |
Graphics Driver | |
| Nvidia GeForce GTX Titan X | 3,072 | 1,000 | 1,076 | 12,288 | 7,012 | 384 | 353.06 | |
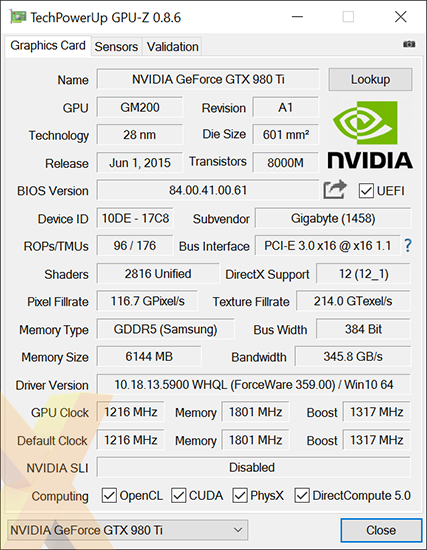
| Gigabyte GeForce GTX 980 Ti Xtreme Gaming WaterForce | 2,816 | 1,216 | 1,317 | 6,144 | 7,204 | 384 | 359.00 | |
| Inno3D iChill GeForce GTX 980 Ti Black | 2,816 | 1,203 | 1,304 | 6,144 | 7,292 | 384 | 358.50 | |
| Nvidia GeForce GTX 980 Ti | 2,816 | 1,000 | 1,076 | 6,144 | 7,012 | 384 | 353.06 | |
| Nvidia GeForce GTX 980 | 2,048 | 1,127 | 1,216 | 4,096 | 7,012 | 256 | 353.06 | |
| Nvidia GeForce GTX 970 | 1,664 | 1,050 | 1,178 | 4,096 | 7,012 | 256 | 353.06 | |
| Nvidia GeForce GTX 780 Ti | 2,880 | 876 | 928 | 3,072 | 7,012 | 384 | 353.06 | |
| Nvidia GeForce GTX 680 | 1,536 | 1,006 | 1,058 | 2,048 | 6,008 | 256 | 353.06 | |
| AMD Radeon R9 Fury X | 4,096 | N/A | 1,050 | 4,096 | 1,000 | 4,096 | 15.15 beta | |
| AMD Radeon R9 Nano | 4,096 | N/A | 1,000 | 4,096 | 1,000 | 4,096 | 15.201 beta | |
| Sapphire Radeon R9 Fury Tri-X | 3,584 | N/A | 1,040 | 4,096 | 1,000 | 4,096 | 15.15 beta | |
| Sapphire Radeon R9 390X Tri-X | 2,816 | N/A | 1,055 | 8,192 | 6,000 | 512 | 15.15 beta | |
| AMD Radeon R9 290X | 2,816 | N/A | 1,000 | 4,096 | 5,000 | 512 | 15.5 beta | |
| AMD Radeon R9 290 | 2,560 | N/A | 947 | 4,096 | 5,000 | 512 | 15.5 beta | |
| AMD Radeon HD 7970 | 2,048 | 925 | N/A | 3,072 | 5,500 | 384 | 15.5 beta | |
HEXUS Graphics Test Bench |
|||
|---|---|---|---|
| Hardware Components | HEXUS Review | Product Page | |
| Processor | Intel Core i7-4770K (quad-core, overclocked up to 4.40GHz) | June 2013 | Intel.com |
| CPU Cooler | Noctua NH-D15 | April 2014 | Noctua.at |
| Motherboard | Asus Z97-A | May 2014 | Asus.co.uk |
| Memory | 16GB Corsair Vengeance Pro (2x8GB) DDR3 @ 1,866MHz | - | Corsair.com |
| Power Supply | Corsair AX760i | - | Corsair.com |
| Primary Storage Device | Crucial M500 240GB SSD | July 2013 | Crucial.com |
| Secondary Storage Device | SK hynix Canvas SC300 512GB SSD | June 2015 | SKhynix.com |
| Chassis | Corsair Graphite Series 600T | October 2010 | Corsair.com |
| Monitor | Philips Brilliance 4K Ultra HD LED (288P6LJEB/00) | - | Philips.co.uk |
| Operating system | Windows 10 (64-bit) | - | Microsoft.com |
Benchmark Suite |
|
|---|---|
| Synthetic Benchmarks | |
| 3DMark | Fire Strike, Fire Strike Extreme and Fire Strike Ultra |
| Gaming Benchmarks and Settings | |
| Alien: Isolation | SMAA-T2x, Maximum Quality |
| BioShock Infinite | AA Enabled, Ultra Preset inc. Depth of Field |
| Grand Theft Auto V | FXAA, 16xAF, Very High Quality |
| Middle-earth: Shadow of Mordor | Ultra Quality Preset |
| Tomb Raider | FXAA, Ultra Quality Preset |
| Total War: Rome II | Extreme Preset |
| The Witcher 3: Wild Hunt | High Quality Preset |
| General Benchmarks | |
| Power Consumption | To emulate real-world usage scenarios, we record system-wide mains power draw both when idle and while playing Grand Theft Auto V. |
| Temperature | To emulate real-world usage scenarios, we record GPU core temperature both when idle and while playing Grand Theft Auto V. |
| Noise | A PCE-318 meter is used to record noise levels when idle and while playing Grand Theft Auto V. |
| Overclocking | Maintaining out-the-box voltage, we increase the card's power target and aim for an optimal balance of core and memory overclock. With the heightened frequencies in place, the 3DMark, Grand Theft Auto V and The Witcher 3: Wild Hunt tests are re-run at 4K UHD settings. |
Notes
To minimise the impact of any CPU bottlenecks, our test platform is configured with a quad-core Intel Core i7-4770K processor overclocked at up to 4.4GHz and 16GB of Corsair Vengeance Pro DDR3 memory set to run at 1,866MHz using the built-in XMP profile.
For our high-end benchmark suite, we have an array of games tested at FHD (1,920x1,080), QHD (2,560x1,440) and 4K UHD (3,840x2,160) resolutions. Where applicable, any vendor-specific enhancements such as PhysX and TressFX are disabled to help even the playing field. In-game benchmark results are recorded as minimum and average frames per second.


