


3DMark 2001SE, 3DMark03
3DMark 2001SE
DX8 theoretical performance first.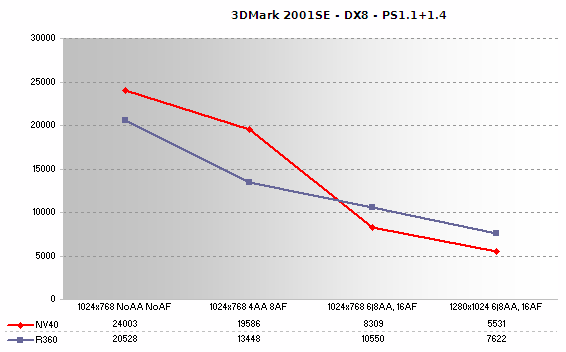
Given previous analysis, the graph above is expected. The R360 is using its scattered grid 6X AA mode at the last two data points, the NV40 its mixed supersampling 8X mode. The performance hit for NVIDIA's top quality AA mode is clearly evident. Mixing supersampling in with the 8X mode reduces its performance under that of the current performance leader.
If 8X is a mode you were looking forward to, you might be concerned.
3DMark03
DX9 theoretical performance now. We're breaking FutureMark's EULA for 03 here, publishing benchmark results for a card with no certified (by FutureMark) driver.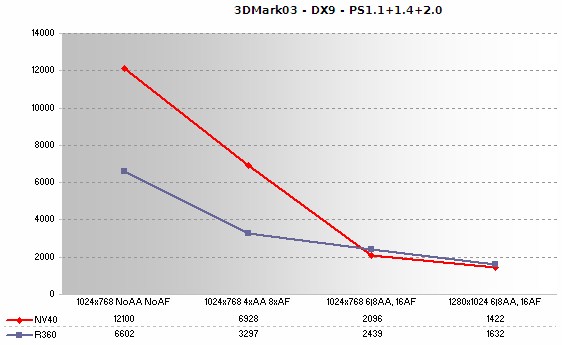
Impressive initially, clearly holding station above R360 by quite some margin, indicating strong DX9 performance. The performance goes south once we mix the 8X mode into things, dropping under R360 by a fair margin.
Overall it's very strong in terms of 3DMark03 performance and it's somewhat prophetic for many graphics cards.


