


Test methodology
Gigabyte HD 7870 OC specification |
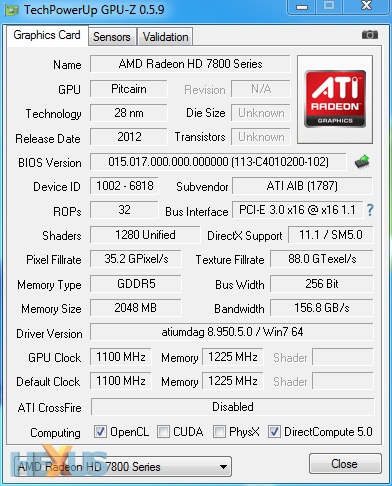
PowerColor HD 7870 PCS+ specification |
|---|---|
 |
 |
GPU comparisons |
|||||||
|---|---|---|---|---|---|---|---|
| Graphics card | GPU clock (MHz) |
Stream processors |
Shader clock (MHz) |
Memory clock (MHz) |
Memory bus (bits) |
Graphics driver | |
| AMD Radeon HD 7970 (3,072MB) | 925 | 2,048 | 925 | 5,500 | 384 | Catalyst 12.1 | |
| AMD Radeon HD 7950 (3,072MB) | 800 | 1,792 | 800 | 5,000 | 384 | Catalyst 12.1 | |
| PowerColor Radeon HD 7870 PCS+ (2,048MB) | 1,100 | 1,280 | 1,100 | 4,900 | 256 | Catalyst 12.1 | |
| Gigabyte Radeon HD 7870 OC (2,048MB) | 1,100 | 1,280 | 1,100 | 4,800 | 256 | Catalyst 12.1 | |
| AMD Radeon HD 7870 (2,048MB) | 1,000 | 1,280 | 1,000 | 4,800 | 256 | Catalyst 12.1 | |
| AMD Radeon HD 7850 (2,048MB) | 860 | 1,024 | 860 | 4,800 | 256 | Catalyst 12.1 | |
| AMD Radeon HD 7770 (1,024MB) | 1,000 | 640 | 1,000 | 4,500 | 128 | Catalyst 12.1 | |
| NVIDIA GeForce GTX 580 (1,536MB) | 772 | 512 | 1,544 | 4,008 | 384 | ForceWare 285.88 | |
| NVIDIA GeForce GTX 570 (1,280MB) | 732 | 480 | 1,464 | 3,800 | 320 | ForceWare 285.88 | |
| NVIDIA GeForce GTX 560 Ti 448 (1,280MB) | 732 | 448 | 1,464 | 3,800 | 320 | ForceWare 285.88 | |
| NVIDIA GeForce GTX 560 Ti (1,024MB) | 822 | 384 | 1,645 | 4,008 | 256 | ForceWare 285.88 | |
Mainstream Test bench |
||||||||||||
|---|---|---|---|---|---|---|---|---|---|---|---|---|
| CPU | Intel Core i5 2500K (3.3GHz, 6MB L3 cache, quad-core, LGA1155) | |||||||||||
| Motherboard | Intel DP67BG | |||||||||||
| Memory | 8GB Corsair Vengeance (9-9-9-24-2T @ 1,600MHz) | |||||||||||
| Power Supply | Corsair AX750 | |||||||||||
| Monitor | Dell 30in 3007WFP | |||||||||||
| Disk drive(s) | Crucial RealSSD C300 (256GB) | |||||||||||
| Chassis | Corsair Graphite Series 600T | |||||||||||
| Operating system | Windows 7 SP1, 64-bit | |||||||||||
Benchmarks |
||||||||||||
|---|---|---|---|---|---|---|---|---|---|---|---|---|
| 3DMark 11 | Performance and Extreme presets | |||||||||||
| Aliens vs. Predator | DX11, 1,280x720 and 1,920x1,080 resolutions, 2xAA, 8xAF, medium quality | |||||||||||
| Batman: Arkham City | DX11, 1,280x720 and 1,920x1,080 resolutions, 4xAA, high quality | |||||||||||
| Battlefield 3 | DX11, 1,280x720 and 1,920x1,080 resolutions, 0xMSAA, 16xAF, high quality | |||||||||||
| Crysis 2 | DX11, 1,280x720 and 1,920x1,080 and resolutions, 0xAA, 16xAF, high quality | |||||||||||
| Just Cause 2 | DX10, 1,280x720 and 1,920x1,080 resolutions, 4xAA, 16xAF, medium quality | |||||||||||
| Total War: Shogun 2 | DX11, 1,280x720 and 1,920x1,080 resolutions, 4xAA, 8xAF, high quality | |||||||||||
| Power consumption | To emulate real-world usage scenarios, we record mains power draw both when idle and whilst playing Total War: Shogun 2 | |||||||||||
| Temperature | To emulate real-world usage scenarios, we record GPU core temperature both when idle and whilst playing Total War: Shogun 2 | |||||||||||
| Noise | A PCE-318 noise level meter is placed at front of a Corsair 600T chassis with side panel on | |||||||||||
| Overclocking | Pushing the graphics card as far as it will go, we increase speeds and re-run the Aliens vs. Predator benchmark | |||||||||||
| HEXUS bang4buck | A custom metric used to evaluate comparative performance with price factored in | |||||||||||


