


Test Methodology
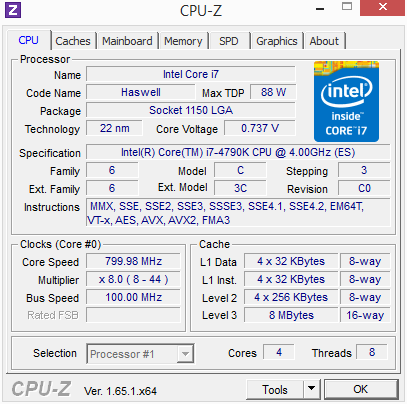
Intel Core i7-4790K Specification |
|---|
 |
Comparison Processor Configurations |
|||||||||||
|---|---|---|---|---|---|---|---|---|---|---|---|
| CPU | AMD |
Intel |
|||||||||
A10-7850K |
A8-7600K |
A10-6800K |
A8-6500T |
Core i7-4790K | Core i7-4770K |
Core i5-4670 |
Core i5-4440 |
Core i3-4330 |
Core i7-4770R |
||
| Chip TDP | 95W |
65W/45W |
100W |
65W |
88W | 84W |
84W |
84W |
54W |
65W |
|
| Current price | £130 |
£90 |
£105 |
£80 |
£240 | £240 |
£160 |
£130 |
£95 |
NA |
|
| Motherboard | ASRock FM2A88X-ITX+ |
Asus Z97-A |
Gigabyte Z87-D3HP | Gigabyte M4HM87P |
|||||||
| BIOS | 1.90 |
0902 |
F5 | NA |
|||||||
| Chipset Driver | AMD Catalyst 13.12 |
Intel Inf 9.4.0.1027 and IMEI 9 |
|||||||||
| DDR3 Memory | AMD Gamer Series 16GB (2x8GB) |
G.Skill 8GB (2x4GB) |
|||||||||
| Memory Timings | 10-11-11-28-2T @ 2,133MHz |
9-10-9-27-2T @ 1,600MHz |
9-10-9-27-2T @ 1,866MHz |
11-11-11-28-2T @ 1,600Hz |
|||||||
| Integrated Graphics | Radeon R7 |
Radeon R7 |
HD 8670D |
HD 8550D |
HD 4600 | HD 4600 |
HD 4600 |
HD 4600 |
HD 4600 |
Iris Pro 5200 |
|
| IGP driver | AMD Catalyst 13.30 RC3 |
Intel 15.33.8.64.3379 |
|||||||||
| Disk Drive | Samsung 840 Pro 250GB |
Intel mSATA 180GB |
|||||||||
| Chassis | Corsair Graphite 600T |
Gigabyte Brix |
|||||||||
| Power Supply | Corsair AX760i |
Gigabyte external |
|||||||||
| Operating System | Windows 8.1 Pro 64-bit |
||||||||||
CPU and Memory Benchmarks |
|||||||||||
| HEXUS PiFast | Our number-crunching benchmark stresses a single core by calculating Pi to 10m places | ||||||||||
| CineBench R15 | Using Cinebench's multi-CPU render, this cross-platform benchmark stresses all cores | ||||||||||
| wPrime 2.1.0 | Another number-crunching benchmark that stresses all available CPU cores/threads | ||||||||||
| AIDA64 v4.00.2805 |
Benchmark that analyses memory bandwidth and latency | ||||||||||
Multimedia Benchmarks |
|||||||||||
| LuxMark 2.0 | An OpenCL rendering benchmark | ||||||||||
| MuseMage 1.9.6 | An OpenCL image-manipulation benchmark (64-bit) | ||||||||||
| HandBrake 0.9.9.1 | Free-to-use video encoder that stresses all CPU cores (64-bit) | ||||||||||
System Benchmarks |
|||||||||||
| PCMark 8 v2.0 | System-wide examination that uses the Home preset, run with OpenCL acceleration | ||||||||||
| 3DMark | DX11, run at the Firestrike default test | ||||||||||
| SiSoft Sandra 2014 | Aggregate score that takes a composite of 12 system-wide benchmarks | ||||||||||
Gaming Benchmarks |
|||||||||||
| BioShock Infinite | DX9, 1,280x720 and 1,920x1,080 medium quality | ||||||||||
| GRID 2 | DX9, 1,280x720 and 1,920x1,080 high quality | ||||||||||
| Total War: Rome II | DX9, 1,280x720 and 1,920x1,080 medium quality | ||||||||||
Miscellaneous Benchmarks |
|||||||||||
| Power Consumption | While idling and when running wPrime and GRID 2 | ||||||||||
Notes
Intel did not provide the chip for review today. It was obtained via a third party and its performance may not be wholly indicative of retail Devil's Canyon processors.
It makes obvious sense to compare against the Core i7-4770K, the chip it replaces as the Haswell head honcho. To keep comparisons fair, we're testing both processors on an Asus Z97-A motherboard equipped with the latest BIOS at the time of writing, version 0902.
It is reasonable to assume that overclocking plays a big part in considering this processor. However, our engineering sample exhibited unexpectedly poor overclocking potential, barely stable at an all-core 4.4GHz. We're awaiting retail samples before doling out advice on just how high the average Core i7-4790K is likely to go: stay tuned for that.


