


Testing Methodology
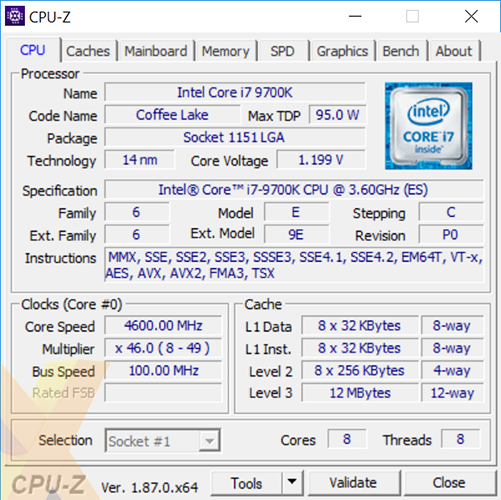
Intel Core i7-9700K Specification |
|---|
 |
Intel Core Processor Configurations |
||||||||||
|---|---|---|---|---|---|---|---|---|---|---|
| CPU | Core i9-7980XE |
Core i9-7900X |
Core i9-9900K |
Core i7-9700K |
Core i7-8700K |
|||||
| CPU Base Clock | 2.6GHz |
3.3GHz |
3.6GHz |
3.6GHz |
3.7GHz |
|||||
| CPU Turbo Clock | 4.4GHz |
4.5GHz |
5.0GHz |
4.9GHz |
4.7GHz |
|||||
| CPU Cache | 24.75MB |
13.75MB |
16MB |
12MB |
12MB |
|||||
| CPU Cores / Threads | 18 / 36 |
10 / 20 |
8 / 16 |
8 / 8 |
6 / 12 |
|||||
| CPU TDP | 165W |
140W |
95W |
95W |
95W |
|||||
| Integrated Graphics | - |
- |
UHD 630 |
UHD 630 |
UHD 630 |
|||||
| IGP Base Clock | - |
- |
350MHz |
350MHz |
350MHz |
|||||
| IGP Turbo Clock | - |
- |
1.20GHz |
1.20GHz |
1.20GHz |
|||||
| Socket | LGA 2066 |
LGA 2066 |
LGA 1151 |
LGA 1151 |
LGA 1151 |
|||||
| Lithography | 14nm |
14nm |
14nm |
14nm |
14nm |
|||||
| Motherboard | Asus Prime X299-A |
MSI MEG Z390 Godlike |
Asus Z390-I Gaming |
Asus Maximus XV Hero |
||||||
| BIOS | 0802 |
E7B10IMS |
0805 |
0801 |
||||||
| Memory | Corsair Dominator 32GB DDR4 |
Corsair Vengeance 32GB DDR4 |
||||||||
| Memory Config | 4x8GB |
4x8GB |
2x16GB |
4x8GB |
||||||
| Memory Timings | 16-17-17-36-2T |
16-17-17-36-2T |
||||||||
| Memory Speed | 2,666MHz |
2,666MHz |
||||||||
| Disk Drive | SK hynix Canvas SC300 (512GB) |
|||||||||
| Power Supply | be quiet Dark Power Pro 11 (1,000W) |
|||||||||
| Graphics Card | Nvidia GeForce GTX 1080 Ti Founders Edition |
|||||||||
| CPU Cooler | Noctua NH-D15S |
|||||||||
| Operating System | Microsoft Windows 10 (64-bit) |
|||||||||
AMD Ryzen Processor Configurations |
|||||||||||
|---|---|---|---|---|---|---|---|---|---|---|---|
| CPU | Threadripper 2990WX |
Threadripper 2970X |
Threadripper 2950X |
Threadripper 1950X |
Ryzen 7 2700X |
||||||
| CPU Base Clock | 3.0GHz |
3.0GHz |
3.5GHz |
3.4GHz |
3.7GHz |
||||||
| CPU Turbo Clock | 4.2GHz |
4.3GHz |
4.4GHz |
4.0GHz |
4.3GHz |
||||||
| CPU L3 Cache | 64MB |
64MB |
32MB |
32MB |
16MB |
||||||
| CPU Cores / Threads | 32 / 64 |
24 / 48 |
16 / 32 |
16 / 32 |
8 / 16 |
||||||
| CPU TDP | 250W |
250W |
180W |
180W |
105W |
||||||
| Integrated Graphics | - |
- |
- |
- |
- |
||||||
| IGP Base Clock | - |
- |
- |
- |
- |
||||||
| IGP Turbo Clock | - |
- |
- |
- |
- |
||||||
| Socket | TR4 |
TR4 |
TR4 |
TR4 |
AM4 |
||||||
| Lithography | 12nm |
12nm |
12nm |
14nm |
12nm |
||||||
| Motherboard | Asus X399 Zenith Extreme |
Asus Crosshair VI Hero |
|||||||||
| BIOS | 0078 |
5704 |
|||||||||
| Memory | G.Skill Trident Z RGB 32GB DDR4 |
Corsair Vengeance 32GB DDR4 |
|||||||||
| Memory Config | 4x8GB |
4x8GB |
|||||||||
| Memory Timings | 16-17-17-36-1T |
16-17-17-36-2T |
|||||||||
| Memory Speed | 2,933MHz |
2,666MHz |
2,933MHz |
||||||||
| Disk Drive | SK hynix Canvas SC300 (512GB) |
||||||||||
| Power Supply | be quiet Dark Power Pro 11 (1,000W) |
||||||||||
| Graphics Card | Nvidia GeForce GTX 1080 Ti Founders Edition |
||||||||||
| CPU Cooler | Cooler Master Wraith Ripper |
Noctua NH-D15S |
|||||||||
| Operating System | Microsoft Windows 10 (64-bit) |
||||||||||
Benchmark Suite |
||||||||||||
|---|---|---|---|---|---|---|---|---|---|---|---|---|
| CPU Benchmarks | ||||||||||||
| HEXUS PiFast | Our number-crunching benchmark stresses a single core by calculating Pi to 10m places | |||||||||||
| Cinebench | Using Cinebench's multi-CPU render, this cross-platform benchmark stresses all cores | |||||||||||
| HandBrake 1.1.0 | Free-to-use video encoder that stresses all CPU cores (64-bit) | |||||||||||
| Blender 2.79 | Using all available cores to run the Victor benchmark | |||||||||||
| Corona 1.3 | Using the high-performance renderer's default benchmark that stresses all cores | |||||||||||
| Keyshot 7.3 | Using ray-tracing and global illumination that scales across all cores | |||||||||||
| Memory Benchmarks | ||||||||||||
| AIDA64 | Benchmark that analyses memory bandwidth and latency | |||||||||||
| Gaming Benchmarks | ||||||||||||
| 3DMark | Graphics benchmark run using Fire Strike and Time Spy tests | |||||||||||
| VRMark | Virtual reality benchmark run using the Cyan Room test | |||||||||||
| F1 2017 | 1,920x1,080 and 3,840x2,160, ultra settings | |||||||||||
| Far Cry 5 | 1,920x1,080 and 3,840x2,160, ultra settings | |||||||||||
| Middle-earth: Shadow of War | 1,920x1,080 and 3,840x2,160, ultra settings | |||||||||||
| Miscellaneous Benchmarks | ||||||||||||
| Power Consumption | To emulate real-world usage scenarios, we record system-wide mains power draw when idle, when rendering via Blender and while playing Middle-earth: Shadow of War | |||||||||||


