


Graphical Tests
Good old 3DMark 2001SE gets us started with the 3D tests, at 1280x1024 as noted before. All three systems use the same Radeon 9800SE All-In-Wonder so these graphical tests make good system differentiators.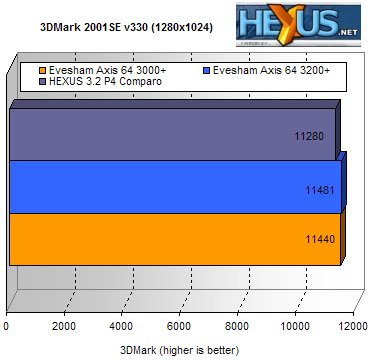
A closer result than expected but the test runs verified the average score. Maybe the Axis 64 3200+ was a little off colour that day, or the Axis 64 3000+ had a spring in its step during 3DMark testing, but the result should have featured a bigger gap. In most real world games tests, the 1MB of L2 on the Model 3200+ should produce a slight, but noticeable, performance improvement.
Unreal Tournament 2003 now to see if we see the same result.
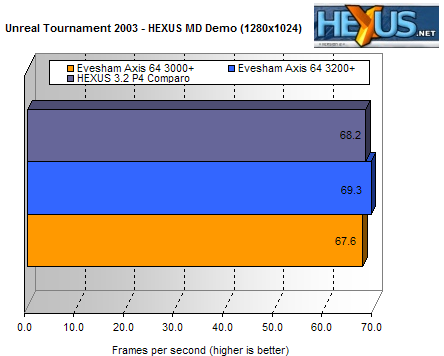
An AMD and P4 sandwich, Intel the filling. The Axis 64 3000+ pulls close to the other two systems, vindicating its choice in the system and indeed any gaming system you wish to put together.
The final gaming test now, X2: The Threat, once again in 1280x1024.
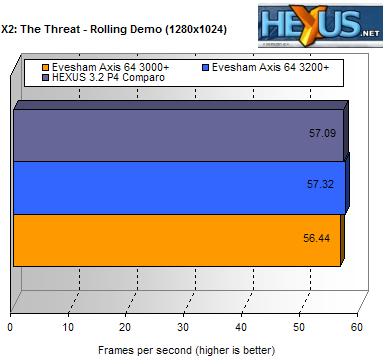
As before, just shy of a the more powerful Axis 64 3200+ and the P4 comparison system. Cache level performance has an effect on games, especially when we are less influenced by the graphics card than we are here. At 1024x768 the Axis 64 3200+ would have a larger gap between itself and the Axis 64 3000+. Conversely, your graphics card choice can be influenced by your CPU, a balance between the two can be struck if you choose wisely. It seems Evesham have done so here, embarassing the performance of the more expensive system a little.
Onto the conclusions.


