


Test Methodology
Sapphire Radeon R9 380X Nitro Specification |
|---|
 |
GPU Comparisons |
||||||||
|---|---|---|---|---|---|---|---|---|
| Graphics Card | GPU Cores | Base Clock (MHz) |
Boost Clock (MHz) |
Memory Size (MB) |
Memory Clock (MHz) |
Memory Bus (bits) |
Graphics Driver | |
| Sapphire Radeon R9 390 Nitro | 2,560 | N/A | 1,010 | 8,192 | 6,000 | 512 | 15.9.1 beta | |
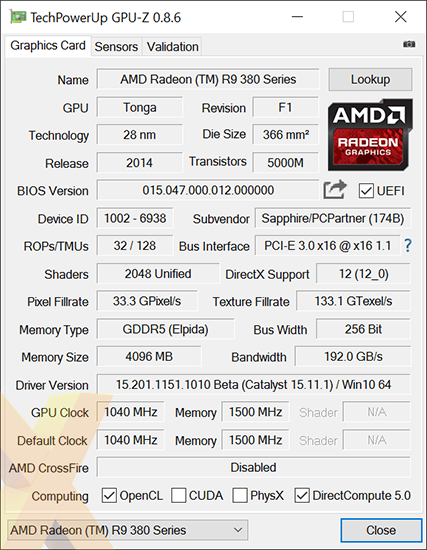
| Sapphire Radeon R9 380X Nitro | 2,048 | N/A | 1,040 | 4,096 | 6,000 | 256 | 15.11.1 beta | |
| Sapphire Radeon HD 7970 | 2,048 | 925 | N/A | 3,072 | 5,500 | 384 | 15.7.1 | |
| Sapphire Radeon R9 380 | 1,792 | 985 | N/A | 4,096 | 5,800 | 256 | 15.7.1 | |
| Sapphire Radeon R7 370 Nitro | 1,024 | 985 | N/A | 4,096 | 5,600 | 256 | 15.7.1 | |
| Gainward GeForce GTX 970 Phoenix | 1,664 | 1,152 | 1,304 | 4,096 | 7,012 | 256 | 355.98 | |
| Gigabyte GeForce GTX 680 OC | 1,536 | 1,072 | 1,137 | 2,048 | 6,008 | 256 | 353.62 | |
| Asus GeForce GTX 960 Strix | 1,024 | 1,253 | 1,317 | 2,048 | 7,200 | 128 | 353.62 | |
| EVGA GeForce GTX 950 SSC | 768 | 1,190 | 1,393 | 2,048 | 6,612 | 128 | 355.65 | |
| Asus GeForce GTX 750 Ti OC | 640 | 1,072 | 1,150 | 2,048 | 5,400 | 128 | 353.62 | |
HEXUS Graphics Test Bench |
|||
|---|---|---|---|
| Hardware Components | HEXUS Review | Product Page | |
| Processor | Intel Core i7-4770K (quad-core, overclocked up to 4.40GHz) | June 2013 | Intel.com |
| CPU Cooler | Noctua NH-D15 | April 2014 | Noctua.at |
| Motherboard | Asus Z97-A | May 2014 | Asus.co.uk |
| Memory | 16GB Corsair Vengeance Pro (2x8GB) DDR3 @ 1,866MHz | - | Corsair.com |
| Power Supply | Corsair AX760i | - | Corsair.com |
| Primary Storage Device | Crucial M500 240GB SSD | July 2013 | Crucial.com |
| Secondary Storage Device | SK hynix Canvas SC300 512GB SSD | June 2015 | SKhynix.com |
| Chassis | Corsair Graphite Series 600T | October 2010 | Corsair.com |
| Monitor | Philips Brilliance 4K Ultra HD LED (288P6LJEB/00) | - | Philips.co.uk |
| Operating system | Windows 10 (64-bit) | October 2012 | Microsoft.com |
Benchmark Suite |
|
|---|---|
| Synthetic Benchmarks | |
| 3DMark | Fire Strike and Fire Strike Extreme |
| Gaming Benchmarks and Settings | |
| Alien: Isolation | SMAA-T2x, Maximum Quality |
| BioShock Infinite | AA Enabled, Ultra Preset inc. Depth of Field |
| Grand Theft Auto V | FXAA, 16xAF, Very High Quality |
| Middle-earth: Shadow of Mordor | Ultra Quality Preset |
| Tomb Raider | FXAA, Ultra Quality Preset |
| Total War: Rome II | Extreme Preset |
| The Witcher 3: Wild Hunt | High Quality Preset |
| General Benchmarks | |
| Power Consumption | To emulate real-world usage scenarios, we record system-wide mains power draw both when idle and while playing Grand Theft Auto V. |
| Temperature | To emulate real-world usage scenarios, we record GPU core temperature both when idle and while playing Grand Theft Auto V. |
| Noise | A PCE-318 meter is used to record noise levels when idle and while playing Grand Theft Auto V. |
| Overclocking | Maintaining out-the-box voltage, we increase the card's power target and aim for an optimal balance of core and memory overclock. With the heightened frequencies in place, the 3DMark and Grand Theft Auto V tests are re-run at QHD settings. |
Notes
To minimise the impact of any CPU bottlenecks, our test platform is configured with a quad-core Intel Core i7-4770K processor overclocked at up to 4.4GHz and 16GB of Corsair Vengeance Pro DDR3 memory set to run at 1,866MHz using the built-in XMP profile.
For our mid-range benchmark suite, we have an array of games tested at FHD (1,920x1,080) and QHD (2,560x1,440) resolutions. Where applicable, any vendor-specific enhancements such as PhysX and TressFX are disabled to help even the playing field. In-game benchmark results are recorded as minimum and average frames per second.


