


Test Methodology
EVGA GTX 980 Ti Superclocked+ ACX 2.0+ |
|---|
 |
GPU Comparisons |
||||||||
|---|---|---|---|---|---|---|---|---|
| Graphics Card | GPU Cores | Base Clock (MHz) |
Boost Clock (MHz) |
Memory Size (MB) |
Memory Clock (MHz) |
Memory Bus (bits) |
Graphics Driver | |
| Nvidia GeForce GTX Titan X | 3,072 | 1,000 | 1,076 | 12,288 | 7,012 | 384 | 347.84 | |
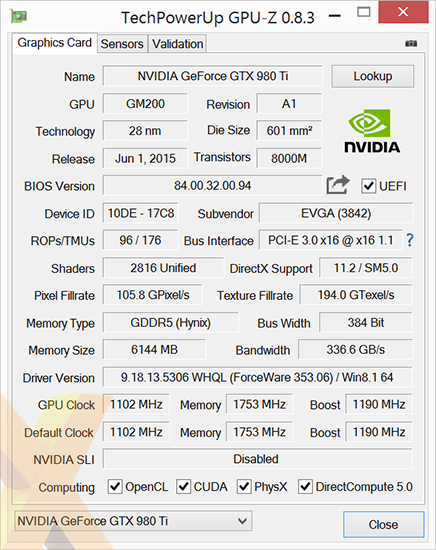
| EVGA GeForce GTX 980 Ti SC+ ACX+ | 2,816 | 1,102 | 1,190 | 6,144 | 7,012 | 384 | 353.06 | |
| Nvidia GeForce GTX 980 Ti | 2,816 | 1,000 | 1,076 | 6,144 | 7,012 | 384 | 352.90 | |
| Nvidia GeForce GTX 980 | 2,048 | 1,127 | 1,216 | 4,096 | 7,012 | 256 | 347.84 | |
| Nvidia GeForce GTX Titan | 2,688 | 837 | 876 | 6,144 | 6,008 | 384 | 347.84 | |
| AMD Radeon R9 295X2 | 2,816 x2 | N/A | 1,018 | 4,096 | 5,000 | 512 x2 | 15.3 beta | |
| AMD Radeon R9 290X | 2,816 | N/A | 1,000 | 4,096 | 5,000 | 512 | 15.3 beta | |
| AMD Radeon R9 290 | 2,560 | N/A | 947 | 4,096 | 5,000 | 512 | 15.3 beta | |
HEXUS Graphics Test Bench |
|||
|---|---|---|---|
| Hardware Components | HEXUS Review | Product Page | |
| Processor | Intel Core i7-4770K (quad-core, overclocked up to 4.40GHz) | June 2013 | Intel.com |
| CPU Cooler | Noctua NH-D15 | April 2014 | Noctua.at |
| Motherboard | Asus Z97-A | May 2014 | Asus.co.uk |
| Memory | 16GB Corsair Vengeance Pro (2x8GB) DDR3 @ 1,866MHz | - | Corsair.com |
| Power Supply | Corsair AX760i | - | Corsair.com |
| Storage Device | Crucial M500 240GB SSD | July 2013 | Crucial.com |
| Chassis | Corsair Graphite Series 600T | October 2010 | Corsair.com |
| Monitor | Philips Brilliance 4K Ultra HD LED (288P6LJEB/00) | - | Philips.co.uk |
| Operating system | Windows 8.1 (64-bit) | October 2012 | Microsoft.com |
Benchmark Suite |
|||
|---|---|---|---|
| Synthetic Benchmarks | |||
| 3DMark | Fire Strike, Fire Strike Extreme and Fire Strike Ultra | ||
| Gaming Benchmarks | |||
| Title | Settings at 1,920x1,080 (FHD) |
Settings at 2,560x1,440 (QHD) |
Settings at 3,840x2,160 (4K UHD) |
| Alien: Isolation | SMAA-T2x, Maximum Quality | SMAA-T2x, Maximum Quality | FXAA, Maximum Quality |
| BioShock Infinite | AA Enabled, Ultra Preset inc. Depth of Field | AA Enabled, Ultra Preset inc. Depth of Field | AA Enabled, Ultra Preset inc. Depth of Field |
| Grid Autosport | 8xMSAA, Maximum Quality Settings (Soft Ambient Occlusion On, Advanced Lighting On, Global Illumination On) | 4xMSAA, Maximum Quality Settings (Soft Ambient Occlusion On, Advanced Lighting On, Global Illumination On) | 4xMSAA, Maximum Quality Settings (Soft Ambient Occlusion On, Advanced Lighting On, Global Illumination On) |
| Middle-earth: Shadow of Mordor | Ultra Quality Preset | Ultra Quality Preset | Very High Quality Preset |
| Tomb Raider | FXAA, Ultra Quality Preset, TressFX Disabled | FXAA, Ultra Quality Preset, TressFX Disabled | FXAA, Ultra Quality Preset, TressFX Disabled |
| Total War: Rome II | Ultra Preset | Ultra Preset | Ultra Preset |
| General Benchmarks | |||
| Power Consumption | To emulate real-world usage scenarios, we record system-wide mains power draw both when idle and while playing Grid Autosport. | ||
| Temperature | To emulate real-world usage scenarios, we record GPU core temperature both when idle and while playing Grid Autosport. | ||
| Noise | A PCE-318 meter is used to record noise levels when idle and while playing Grid Autosport. | ||
| Overclocking | Maintaining out-the-box voltage, we increase the card's power target and aim for an optimal balance of core and memory overclock. With the heightened frequencies in place, the 3DMark, Alien: Isolation and Total War: Rome II tests are re-run at 4K UHD settings. | ||
Notes
To minimise the impact of any CPU bottlenecks, our test platform is configured with a quad-core Intel Core i7-4770K overclocked at up to 4.4GHz. 16GB of Corsair Vengeance Pro DDR3 is set to run at 1,866MHz using the built-in XMP profile.
For our high-end benchmark suite, we have an array of games tested at FHD (1,920x1,080), QHD (2,560x1,440) and 4K UHD (3,840x2,160) resolutions. In an effort to maintain playable framerates in the latter modes, the level of image quality may be reduced and any such changes are highlighted using bold in the table above. Readers should note that, despite running with lowered settings, games often look superior at QHD and 4K UHD as a result of the increase in on-screen pixels.
Where applicable, any vendor-specific enhancements such as PhysX and TressFX are disabled to help even the playing field. In-game benchmark results are recorded as minimum and average frames per second.


