Test Methodology
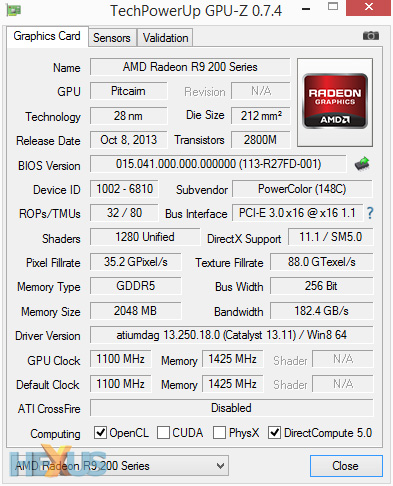
PowerColor Radeon R9 270X PCS+ Specification |
|---|
 |
GPU Comparisons |
||||||
|---|---|---|---|---|---|---|
| Graphics Card | Peak Core Clock (MHz) |
Stream Processors |
Memory Clock (MHz) |
Memory Bus (bits) |
Graphics Driver | |
| AMD Radeon R9 290X 4GB | 1,000 | 2,816 | 5,000 | 512 | Catalyst 13.11 v8 | |
| AMD Radeon R9 290 4GB | 947 | 2,560 | 5,000 | 512 | Catalyst 13.11 v8 | |
| AMD Radeon R9 280X 3GB | 1,000 | 2,048 | 6,000 | 384 | Catalyst 13.11 | |
| AMD Radeon HD 7970 GE 3GB | 1,050 | 2,048 | 6,000 | 384 | Catalyst 13.11 | |
| AMD Radeon HD 7950 3GB | 800 | 1,792 | 5,000 | 384 | Catalyst 13.11 | |
| PowerColor Radeon R9 270X PCS+ 2GB | 1,100 | 1,280 | 5,700 | 256 | Catalyst 13.11 v9.5 | |
| AMD Radeon R9 270X 2GB | 1,050 | 1,280 | 5,600 | 256 | Catalyst 13.11 | |
| Sapphire Radeon R9 270 2GB | 945 | 1,280 | 5,600 | 256 | Catalyst 13.11 v9 | |
| AMD Radeon HD 7870 2GB | 1,000 | 1,280 | 4,800 | 256 | Catalyst 13.11 | |
| AMD Radeon R7 260X 2GB | 1,100 | 896 | 6,400 | 128 | Catalyst 13.11 | |
| Nvidia GeForce GTX Titan 6GB | 876 | 2,688 | 6,008 | 384 | GeForce 331.40 | |
| Nvidia GeForce GTX 780 Ti 3GB | 928 | 2,880 | 7,012 | 384 | GeForce 331.70 | |
| Nvidia GeForce GTX 780 3GB | 900 | 2,304 | 6,008 | 384 | GeForce 331.40 | |
| Nvidia GeForce GTX 770 2GB | 1,085 | 1,536 | 7,012 | 256 | GeForce 331.40 | |
| Nvidia GeForce GTX 760 2GB | 1,033 | 1,152 | 6,008 | 256 | GeForce 331.40 | |
| Nvidia GeForce GTX 670 2GB | 980 | 1,344 | 6,008 | 256 | GeForce 331.40 | |
| EVGA GeForce GTX 660 SC 2GB | 1,111 | 960 | 6,008 | 192 | GeForce 331.40 | |
| Nvidia GeForce GTX 650 Ti Boost 2GB | 1,032 | 768 | 6,008 | 192 | GeForce 331.40 | |
HEXUS Graphics Test Bench |
|
|---|---|
| Processor | Intel Core i7-4770K (3.50GHz, 8MB cache, quad-core) |
| CPU Cooler | Intel reference E97378-001 |
| Motherboard | Gigabyte GA-Z87X-UD3H |
| Memory | 16GB G.Skill RipJaws (2x8GB) DDR3 @ 1,600MHz |
| Power Supply | Corsair AX760i |
| Storage Device | Crucial M500 240GB SSD |
| Chassis | Corsair Graphite Series 600T |
| Monitor | Philips Brilliance 272P (2,560x1,440) |
| Operating system | Windows 8.1 64-bit |
HEXUS High-End Benchmark Suite |
||
|---|---|---|
| GPU Benchmarks | Mode and Resolutions | Quality Settings |
| 3DMark | DX11 at 1,920x1,080 and 2,560x1,440 | Fire Strike and Fire Strike Extreme |
| BioShock Infinite | DX11 at 1,920x1,080 and 2,560x1,440 | Ultra + DOF |
| Crysis 3 | DX11 at 1,920x1,080 and 2,560x1,440 | 4xMSAA, High Preset |
| Far Cry 3 | DX11 at 1,920x1,080 and 2,560x1,440 | 2xMSAA, Ultra Preset |
| GRID 2 | DX11 at 1,920x1,080 and 2,560x1,440 | 4xMSAA, Ultra Preset |
| Just Cause 2 | DX10 at 1,920x1,080 and 2,560x1,440 | 8xMSAA, High Preset |
| Total War: Rome II | DX11 at 1,920x1,080 and 2,560x1,440 | 4xMSAA, High Preset |
| General Benchmarks | Description | |
| Power Consumption | To emulate real-world usage scenarios, we record mains power draw both when idle and while playing Far Cry 3 | |
| Temperature | To emulate real-world usage scenarios, we record GPU core temperature both when idle and while playing Far Cry 3 | |
| Noise | A PCE-318 meter is used to record noise levels when idle and while playing Far Cry 3 | |


