


Testing methodology
GPU Comparisons |
|||||||
|---|---|---|---|---|---|---|---|
| Graphics Card | GPU Clock (MHz) |
Stream Processors |
Shader Clock (MHz) |
Memory Clock (MHz) |
Memory Bus (bits) |
Graphics Driver | |
| AMD Radeon R9 290X 4GB | 1,000 | 2,816 | 1,000 | 5,000 | 512 | Catalyst 13.11 v5 | |
| AMD Radeon R9 280X 3GB | 1,000 | 2,048 | 1,000 | 6,000 | 384 | Catalyst 13.11 | |
| AMD Radeon HD 7970 GE 3GB | 1,000 (1,050) | 2,048 | 1,000 (1,050) | 6,000 | 384 | Catalyst 13.11 | |
| AMD Radeon HD 7950 3GB | 800 | 1,792 | 800 | 5,000 | 384 | Catalyst 13.11 | |
| AMD Radeon R9 270X 2GB | 1,050 | 1,280 | 1,050 | 5,600 | 256 | Catalyst 13.11 | |
| AMD Radeon HD 7870 2GB | 1,000 | 1,280 | 1,000 | 4,800 | 256 | Catalyst 13.11 | |
| AMD Radeon R7 260X 2GB | 1,100 | 896 | 1,100 | 6,400 | 128 | Catalyst 13.11 | |
| Nvidia GeForce GTX Titan 6GB | 837 (876) | 2,688 | 836 (875) | 6,008 | 384 | GeForce 331.40 | |
| Nvidia GeForce GTX 780 3GB | 863 (900) | 2,304 | 863 (900) | 6,008 | 384 | GeForce 331.40 | |
| Nvidia GeForce GTX 770 2GB | 1,046 (1,085) | 1,536 | 1,046 (1,085) | 7,012 | 256 | GeForce 331.40 | |
| Nvidia GeForce GTX 760 2GB | 980 (1,033) | 1,152 | 980 (1,033) | 6,008 | 256 | GeForce 331.40 | |
| Nvidia GeForce GTX 670 2GB | 915 (980) | 1,344 | 915 (980) | 6,008 | 256 | GeForce 331.40 | |
| Nvidia GeForce GTX 660 2GB | 980 (1,032) | 960 | 980 (1,032) | 6,008 | 192 | GeForce 331.40 | |
| Nvidia GeForce GTX 650 Ti Boost 2GB | 980 (1,032) | 768 | 980 (1,032) | 6,008 | 192 | GeForce 331.40 | |
HEXUS Graphics Test Bench |
|
|---|---|
| Processor | Intel Core i7-4770K (3.50GHz, 8MB cache, quad-core) |
| CPU Cooler | Intel reference E97378-001 |
| Motherboard | Gigabyte GA-Z87X-UD3H |
| Memory | 16GB G.Skill RipJaws (2x8GB) DDR3 @ 1,600MHz |
| Power Supply | Corsair AX760i |
| Storage Device | Crucial M500 240GB SSD |
| Chassis | Corsair Graphite Series 600T |
| Monitor | Philips Brilliance 272P (2,560x1,440) |
| Operating system | Windows 8 64-bit |
HEXUS High-End Benchmark Suite |
||
|---|---|---|
| GPU Benchmarks | Mode and Resolutions | Quality Settings |
| 3DMark | DX11 at 1,920x1,080 and 2,560x1,440 | Fire Strike and Fire Strike Extreme |
| BioShock Infinite | DX11 at 1,920x1,080 and 2,560x1,440 | Ultra + DOF |
| Crysis 3 | DX11 at 1,920x1,080 and 2,560x1,440 | 4xMSAA, High Preset |
| Far Cry 3 | DX11 at 1,920x1,080 and 2,560x1,440 | 2xMSAA, Ultra Preset |
| GRID 2 | DX11 at 1,920x1,080 and 2,560x1,440 | 4xMSAA, Ultra Preset |
| Just Cause 2 | DX10 at 1,920x1,080 and 2,560x1,440 | 8xMSAA, High Preset |
| Total War: Rome II | DX11 at 1,920x1,080 and 2,560x1,440 | 4xMSAA, High Preset |
| General Benchmarks | Description | |
| Power Consumption | To emulate real-world usage scenarios, we record mains power draw both when idle and while playing Far Cry 3 | |
| Temperature | To emulate real-world usage scenarios, we record GPU core temperature both when idle and while playing Far Cry 3 | |
| Noise | A PCE-318 meter is used to record noise levels when idle and while playing Far Cry 3 | |
Frequency matters
Remember how we mentioned that the R9 290X GPU modulates speed based on target temperature and power consumption? Using the standard quiet mode setting, we played through 10 minutes of intense Far Cry 3 action and logged the per-second GPU frequency, as shown in the graph below.
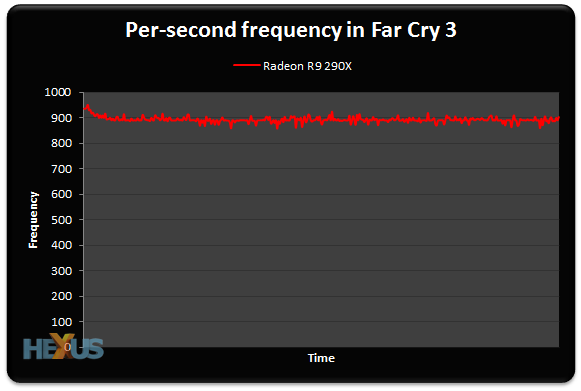
Note that the GPU doesn't scale up to 1,000MHz at any one-second point. In fact the average speed is 912.5MHz, though it differs from game to game. Just Cause 2, for example, enables the GPU to run at 984MHz while Crysis 3's average speed is 931MHz. The key aspect to understand here is that no two R9 290X cards will perform at exactly the same level, because no two PC systems are exactly alike.
Running the same test with uber mode increased the core frequency by, on average, three per cent. The benchmarks on the following page are run with quiet mode, which is the standard setting for the comparison GeForce cards, but we flicked over to uber mode for overclocking.
We've singled-out the R9 290X and GTX Titan cards in the ensuing graphs, purely because they're the two best GPUs from each company, but do also pay attention to the GTX 780's results - it is closest to the AMD card with respect to price.


