


Bang4buck, Bang4watt, and overclocking
Putting all the numbers into perspective, let's take a closer look at overall performance and value for money.
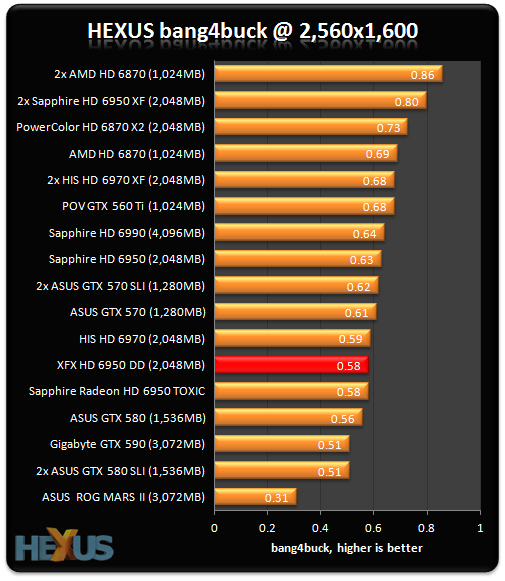
In a rough-and-ready assessment of the cards' bang for buck, we've aggregated the 2,560x1,600 frame-rates for six games, normalised them1 and taken account of today's pricing.
But there are more provisos than we'd care to shake a stick at. We could have chosen six different games, the cards' prices could have been derived from other sources and pricing tends to fluctuate daily, especially for new-release GPUs.
Consequently, the table below highlight a metric that should only be used as a yardstick for evaluating comparative performance with price factored in. Other architectural benefits are not covered, obviously.
Value analysis at 2,560x1,600 |
|||||||
|---|---|---|---|---|---|---|---|
| Graphics card | Aggregate FPS | Normalised FPS | Current price | Bang4buck1 | Power consumption2 | Bang4watt3 | |
| Sapphire Radeon HD 6990 (4,096MB) | 406.8 | 337.2 | £530 | 0.64 | 352 | 0.96 | |
| 2x HIS Radeon HD 6970 in CrossFire (4,096MB) | 427.7 | 354.4 | £520 | 0.68 | 465 | 0.76 | |
| HIS Radeon HD 6970 (2,048MB) | 232.0 | 152.6 | £260 | 0.59 | 193 | 0.79 | |
| 2x Sapphire Radeon HD 6950 in CrossFire (4,096MB) | 390.8 | 319.9 | £400 | 0.80 | 303 | 1.06 | |
| Sapphire Radeon HD 6950 TOXIC | 215.1 | 135.9 | £235 | 0.58 | 176 | 0.78 | |
| XFX Radeon HD 6950 (2,048MB) | 213.4 | 133.3 | £230 | 0.58 | 166 | 0.80 | |
| Sapphire Radeon HD 6950 (2,048MB) | 207.6 | 126.7 | £200 | 0.63 | 130 | 0.98 | |
| PowerColor Radeon HD 6870 X2 (2,048MB) | 299.0 | 229.5 | £315 | 0.73 | 317 | 0.72 | |
| 2x AMD Radeon HD 6870 (1,024MB) | 304.9 | 240.1 | £280 | 0.86 | 295 | 0.81 | |
| AMD Radeon HD 6870 (1,024MB) | 173.0 | 96.7 | £140 | 0.69 | 124 | 0.78 | |
| ASUS ROG MARS II (3,072MB) | 434.3 | 360.9 | £1,149 | 0.31 | 490 | 0.74 | |
| Gigabyte GeForce GTX 590 (3,072MB) | 361.9 | 305.6 | £600 | 0.51 | 376 | 0.81 | |
| 2x ASUS GeForce GTX 580 in SLI (3,072MB) | 423.4 | 356.5 | £700 | 0.51 | 524 | 0.68 | |
| ASUS GeForce GTX 580 (1,536MB) | 256.9 | 196.8 | £350 | 0.56 | 256 | 0.55 | |
| 2x ASUS GeForce GTX 570 in SLI (2,560MB) | 365.7 | 309.1 | £500 | 0.62 | 419 | 0.74 | |
| ASUS GeForce GTX 570 (1,280MB) | 218.6 | 152.4 | £250 | 0.61 | 205 | 0.74 | |
| Point of View GeForce GTX 560 Ti (1,024MB) | 175.1 | 109.5 | £160 | 0.68 | 165 | 0.66 | |
1 the normalisation refers to taking playable frame rate into account. Should a card benchmark at over 60 frames per second in any one game, the extra fps count as half. Similarly, should a card benchmark lower, say at 40fps, we deduct half the difference from its average frame rate and the desired 60fps, giving it a HEXUS.bang4buck score of 30 marks. The minimum allowable frame rate is 20fps but that scores zero.
2 the GPU power consumption is derived from subtracting a flat rate of 100W - indicating system power-draw without a card - from the Call of Duty: Black Ops load figure. While this figure isn't solely indicative of power pulled by the GPU, as the CPU also throttles up, it's a better metric than using peak system-draw alone.
3 the HEXUS.bang4watt score is a crude measurement of how much normalised performance the GPU provides when evaluated against GPU power-draw that's shown in the table: the former is divided by the latter. We're using the peak power-draw numbers obtained by running real-world Just Cause 2.
Summary
While we have little but praise for the card itself, a high street price is manifested, rather obviously, with a low HEXUS.bang4buck.
Overclocking
XFX has set a conservative 830MHz clock on this card while not overclocking memory at all. Righting this egregious wrong, we cranked up the core voltage to 1.2V and the clocks to a stable 910MHz core and 5,550MHz memory. Running our benchmarks again at the 2,560x1,600 setting we noticed an across-the-board improvement of 6.8 per cent.


