


HEXUS.bang4buck and bang4watt
Putting all the numbers into perspective, let's take a closer look at overall performance.
In a rough-and-ready assessment of the cards' bang for buck, we've aggregated the 1,920x1,080 and 2,560x1,600 frame-rates for six games, normalised them* and taken account of the single-cards' prices.
But there are more provisos than we'd care to shake a stick at. We could have chosen six different games, the cards' prices could have been derived from other sources and pricing tends to fluctuate daily, especially for new-release GPUs.
Consequently, the table below highlight a metric that should only be used as a yardstick for evaluating comparative performance with price factored in. Other architectural benefits are not covered, obviously.
1,920x1,080
GPU comparisons |
|||||||
|---|---|---|---|---|---|---|---|
| Graphics card | Aggregate FPS | Normalised FPS | Current price | Bang4buck | Power consumption | Bang4watt | |
| Gigabyte GeForce GTX 590 3,072MB 'OC' | 574.9 | 454.45 | £605 | 0.75 | 433 | 1.05 | |
| Gigabyte GeForce GTX 590 3,072MB | 538.4 | 433.5 | £605 | 0.72 | 393 | 1.10 | |
| ASUS GeForce GTX 580 SLI | 620.4 | 486.9 | £770 | 0.63 | 524 | 0.93 | |
| ASUS GeForce GTX 570 SLI | 553.5 | 443.4 | £540 | 0.82 | 419 | 1.06 | |
| ASUS GeForce GTX 580 1,536MB | 387.7 | 331.5 | £385 | 0.86 | 256 | 1.30 | |
| ASUS GeForce GTX 570 1,280MB | 337 | 287.1 | £270 | 1.06 | 205 | 1.40 | |
| Sapphire Radeon HD 6990 4,096MB OC | 554.8 | 447.5 | £540 | 0.83 | 399 | 1.12 | |
| Sapphire Radeon HD 6990 4,096MB | 545.6 | 443.9 | £540 | 0.82 | 349 | 1.27 | |
| HIS Radeon HD 6970 XF | 568.4 | 458 | £570 | 0.8 | 465 | 0.98 | |
| Sapphire Radeon HD 6950 XF | 536.9 | 437.2 | £410 | 1.07 | 303 | 1.44 | |
| HIS Radeon HD 6970 2,048MB | 352.8 | 300.1 | £285 | 1.05 | 193 | 1.55 | |
| Sapphire Radeon HD 6950 2,048MB | 320 | 262.6 | £205 | 1.28 | 130 | 2.02 | |
| Sapphire Radeon HD 5970 2,048MB | 466.8 | 381.2 | £500 | 0.76 | 257 | 1.49 | |
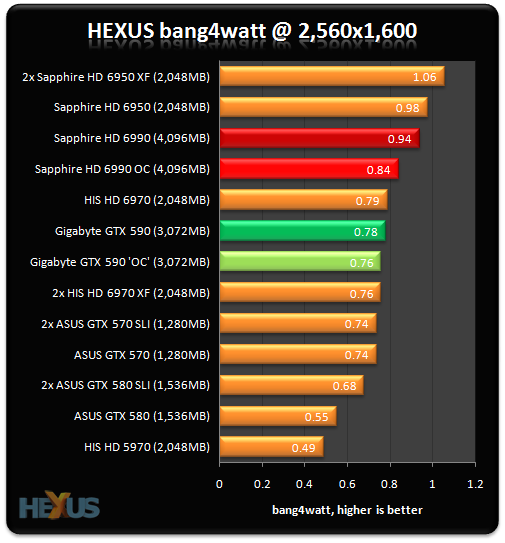
2,560x1,600
GPU comparisons |
|||||||
|---|---|---|---|---|---|---|---|
| Graphics card | Aggregate FPS | Normalised FPS | Current price | Bang4buck* | Power consumption* | Bang4watt | |
| Gigabyte GeForce GTX 590 3,072MB 'OC' | 386.6 | 329.7 | £605 | 0.54 | 433 | 0.76 | |
| Gigabyte GeForce GTX 590 3,072MB | 361.7 | 306.9 | £605 | 0.51 | 393 | 0.78 | |
| ASUS GeForce GTX 580 SLI | 423.4 | 356.5 | £770 | 0.46 | 524 | 0.68 | |
| ASUS GeForce GTX 570 SLI | 365.7 | 309.1 | £540 | 0.57 | 419 | 0.74 | |
| ASUS GeForce GTX 580 1,536MB | 256.9 | 196.8 | £385 | 0.51 | 256 | 0.55 | |
| ASUS GeForce GTX 570 1,280MB | 218.6 | 152.4 | £270 | 0.56 | 205 | 0.74 | |
| Sapphire Radeon HD 6990 4,096MB OC | 404.3 | 335.9 | £540 | 0.62 | 399 | 0.84 | |
| Sapphire Radeon HD 6990 4,096MB | 393.2 | 326.6 | £540 | 0.60 | 349 | 0.94 | |
| HIS Radeon HD 6970 XF | 427.7 | 354.4 | £570 | 0.62 | 465 | 0.76 | |
| Sapphire Radeon HD 6950 XF | 390.8 | 319.9 | £410 | 0.78 | 303 | 1.06 | |
| HIS Radeon HD 6970 2,048MB | 232 | 152.6 | £285 | 0.54 | 193 | 0.79 | |
| Sapphire Radeon HD 6950 2,048MB | 207.6 | 126.7 | £205 | 0.62 | 130 | 0.98 | |
| Sapphire Radeon HD 5970 2,048MB | 286.4 | 205.6 | £500 | 0.41 | 257 | 0.49 | |
* the normalisation refers to taking playable frame rate into account. Should a card benchmark at over 60 frames per second in any one game, the extra fps count as half. Similarly, should a card benchmark lower, say at 40fps, we deduct half the difference from its average frame rate and the desired 60fps, giving it a HEXUS.bang4buck score of 30 marks. The minimum allowable frame rate is 20fps but that scores zero.
** the GPU power consumption is derived from subtracting a flat rate of 100W - indicating system power-draw without a card - from the Call of Duty: Black Ops load figure. While this figure isn't solely indicative of power pulled by the GPU, as the CPU also throttles up, it's a better metric than using peak system-draw alone.
*** the HEXUS.bang4watt score is a crude measurement of how much normalised performance the GPU provides when evaluated against GPU power-draw that's shown in the table: the former is divided by the latter. We're using the peak power-draw numbers obtained by running real-world Just Cause 2.
Analysis
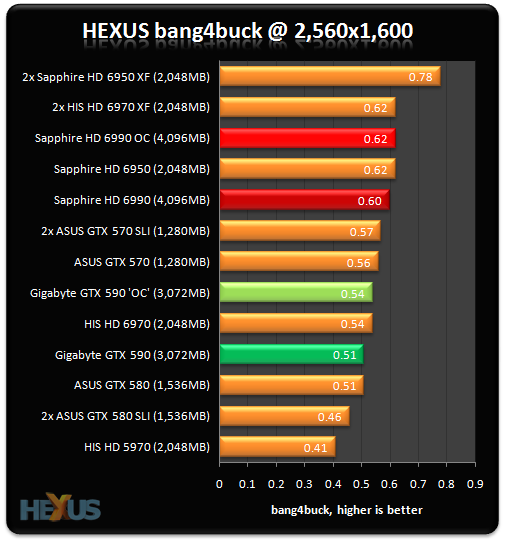
It takes an overclocked GTX 590 to mete out the same gaming performance as a Radeon HD 6990 (non-OC). The Radeon card is significantly cheaper - £540 vs. £605 - so it's bang4buck is a higher.
The regular Gigabyte GTX 590, which is really the card we should be concentrating on, is just as expensive and doesn't perform as well, hence the lower score.
HEXUS bang4watt is interesting. The GTX 590 is behind the Radeons because it offers lower normalised performance and a similar power-draw. Matching it is our engineered 'OC' which, while faster, chews through more watts.
The bottom line here is that NVIDIA's card either draws the same number of watts and has lower performance or it can deliver the same performance at a higher power-draw. Take those into account and the two graphs make implicit sense.


