


How we test - 16-card line-up
GPU comparisons |
|||||||
|---|---|---|---|---|---|---|---|
| Graphics cards | Current pricing | GPU clock (MHz) | Stream processors | Shader clock (MHz) | Memory clock (MHz) | Memory bus (bits) | Graphics driver |
| NVIDIA GeForce GTX 580 1,536MB | £395 | 772 | 512 | 1,544 | 4,008 | 384 | ForceWare 262.99 |
| NVIDIA GeForce GTX 570 1,280MB | £265 | 732 | 480 | 1,464 | 3,800 | 320 | ForceWare 263.09 |
| ASUS GeForce GTX 480 1,536MB | £325 | 700 | 480 | 1,401 | 3,698 | 384 | ForceWare 262.99 |
| ASUS GeForce GTX 470 1,280MB | £190 | 607 | 448 | 1,215 | 3,348 | 320 | ForceWare 260.89 |
| Gigabyte GeForce GTX 560 Ti SOC 1,024MB |
£230 | 1,000 | 384 | 2,000 | 4,580 | 256 | ForceWare 266.56 |
| KFA2 GeForce GTX 560 Ti LTD OC 1,024MB |
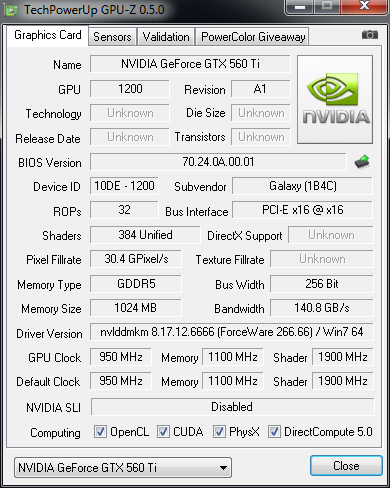
£240 | 950 | 384 | 1,900 | 4,400 | 256 | ForceWare 266.66 |
| NVIDIA GeForce GTX 560 Ti 1,024MB |
£200 | 822 | 384 | 1,644 | 4,008 | 256 | ForceWare 266.56 |
| KFA2
GeForce GTX 460 1,024MB |
£140 | 675 | 336 | 1,350 | 3,600 | 256 | ForceWare 266.56 |
| EVGA GeForce GTX 460 768MB | £135 | 675 | 336 | 1,350 | 3,600 | 192 | ForceWare 260.89 |
| HIS Radeon HD 5970 2,048MB | £500 | 725 | 3,200 | 725 | 4,000 | 256 x 2 | Catalyst 10.12P |
| HIS Radeon HD 6970 2,048MB | £280 | 880 | 1,536 | 880 | 5,500 | 256 | Catalyst 10.12P |
| Sapphire Radeon HD 6950 2,048MB | £230 | 800 | 1,440 | 800 | 5,000 | 256 | Catalyst 10.12 |
| HIS Radeon HD 6870 1,024MB | £175 | 900 | 1,120 | 900 | 4,200 | 256 | Catalyst 10.12 |
| Sapphire Radeon HD 6850 1,024MB | £150 | 775 | 960 | 775 | 4,000 | 256 | Catalyst 10.12 |
| XFX Radeon HD 5870 1,024MB | £190 | 825 | 1,600 | 825 | 4,800 | 256 | Catalyst 10.10P |
| XFX Radeon HD 5850 1,024MB | £155 | 725 | 1,440 | 725 | 4,000 | 256 | Catalyst 10.10P |
Test bench |
||||||||||||
|---|---|---|---|---|---|---|---|---|---|---|---|---|
| CPU | Intel Core i7 980X Extreme Edition (3.33GHz, 12MB L3 cache, hexa-core, LGA1366 - Turbo Boost enabled) | |||||||||||
| Motherboard | ASUS P6X58D Premium | |||||||||||
| Motherboard BIOS | 1002 | |||||||||||
| Memory | 6GB Corsair DDR3 | |||||||||||
| Memory timings and speed | 9-9-9-24-1T @ DDR3-1,600 | |||||||||||
| PSU | Corsair HX1000W | |||||||||||
| Monitor | Dell 30in 3007WFP - 2,560x1,600px | |||||||||||
| Disk drive(s) | Corsair Force F80 SSD | |||||||||||
| Operating system | Windows 7 Ultimate, 64-bit | |||||||||||
Benchmarks |
||||||||||||
|---|---|---|---|---|---|---|---|---|---|---|---|---|
| Aliens vs. Predator | DX11, 1,680x1,050, 1,920x1,080, 2,560x1,600 resolutions, 2xAA, 16xAF, very high quality. | |||||||||||
| Just Cause 2 | DX10, 1,680x1,050, 1,920x1,080, 2,560x1,600 resolutions, 4xAA, 16xAF, Dark Tower benchmark | |||||||||||
| Mafia II | DX9, 1,680x1,050, 1,920x1,080, 2,560x1,600 resolutions, AA on, 16x AF, built-in benchmark | |||||||||||
| Battlefield: Bad Company 2 | DX11, 1,680x1,050, 1,920x1,080, 2,560x1,600 resolutions, 4xAA, 16xAF, ultra quality, FRAPS-recorded benchmark. | |||||||||||
| Call of Duty: Black Ops | DX9, 1,680x1,050, 1,920x1,080, 2,560x1,600 resolutions, 4xAA, ultra quality, FRAPS-recorded benchmark. | |||||||||||
| Crysis Warhead | DX10, 1,680x1,050, 1,920x1,080, 2,560x1,600 resolutions, 4xAA, gamer quality, Frost map, FRAPS-recorded benchmark. | |||||||||||
| DiRT 2 | DX11, 1,680x1,050, 1,920x1,080, 2,560x1,600 resolutions, 4xAA, ultra quality, London map. | |||||||||||
| Temperature | To emulate real-world usage scenarios, we record GPU core temperature both when idle and whilst playing Call of Duty: Black Ops. And, for a worst-case scenario, we throw in numbers from the FurMark stress test. | |||||||||||
| Power consumption | To emulate real-world usage scenarios, we record mains power draw both when idle and whilst playing Call of Duty: MW2. And, for a worst-case scenario, we throw in numbers from the FurMark stress test. | |||||||||||
| Noise | A PCE-318 noise level meter is placed at front of a Corsair 700D chassis with side panel on. | |||||||||||
Notes
There's some healthy high-end competition in this line-up. We recommend that you take a look at the comparative performance of the reference 560 Ti, Gigabyte's 1,000MHz/4,580MHz-clocked SOC, and AMD's Radeon HD 6950 2GB.


