Test Methodology
GPU Comparisons |
||||||||||
|---|---|---|---|---|---|---|---|---|---|---|
GPU |
Memory |
Miscellaneous |
||||||||
Cores |
Base (MHz) |
Boost (MHz) |
Type |
Size (MB) |
Clock (MHz) |
Bus (bits) |
Power Config |
Driver |
||
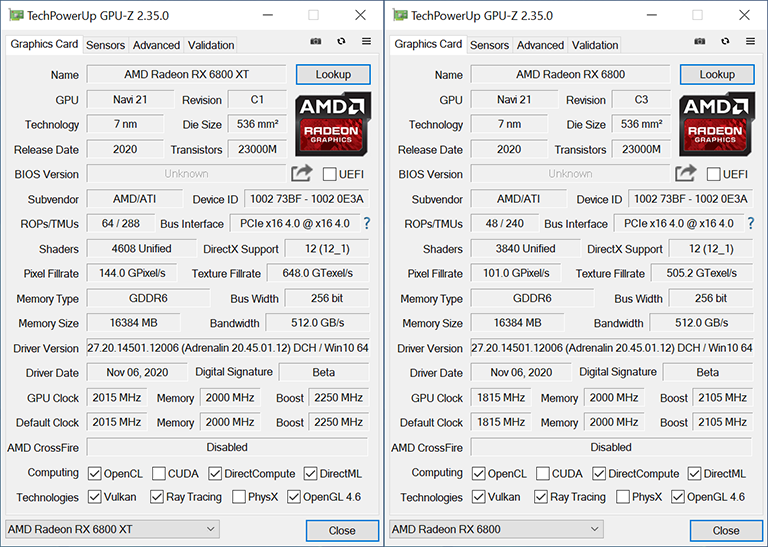
| AMD Radeon RX 6800 XT | 4,608 |
2,015 |
2,250 |
GDDR6 |
16,384 |
16,000 |
256 |
8+8 |
20.45 |
|
| AMD Radeon RX 6800 | 3,840 |
1,815 |
2,105 |
GDDR6 |
16,384 |
16,000 |
256 |
8+8 |
20.45 |
|
| AMD Radeon RX 5700 XT | 2,560 |
1,605 |
1,905 |
GDDR6 |
8,192 |
14,000 |
256 |
6+8 |
20.8.3 |
|
| AMD Radeon RX 5700 | 2,304 |
1,465 |
1,725 |
GDDR6 |
8,192 |
14,000 |
256 |
6+8 |
20.8.3 |
|
| MSI GeForce RTX 3090 Gaming X Trio | 10,496 |
1,395 |
1,785 |
GDDR6X |
24,576 |
19,500 |
384 |
8+8+8 |
456.71 |
|
| MSI GeForce RTX 3080 Gaming X Trio | 8,704 |
1,440 |
1,815 |
GDDR6X |
10,240 |
19,000 |
320 |
8+8+8 |
456.16 |
|
| Nvidia GeForce RTX 3080 Founders Edition | 8,704 |
1,440 |
1,710 |
GDDR6X |
10,240 |
19,000 |
320 |
12 |
457.30 |
|
| MSI GeForce RTX 3070 Gaming X Trio | 5,888 |
1,500 |
1,830 |
GDDR6 |
8,192 |
14,000 |
256 |
8+8 |
456.96 |
|
| Nvidia GeForce RTX 3070 Founders Edition | 5,888 |
1,500 |
1,725 |
GDDR6 |
8,192 |
14,000 |
256 |
12 |
456.96 |
|
| Nvidia GeForce RTX 2080 Ti Founders Edition | 4,352 |
1,350 |
1,635 |
GDDR6 |
11,264 |
14,000 |
352 |
8+8 |
456.16 |
|
| Nvidia GeForce RTX 2080 Super Founders Edition | 3,072 |
1,650 |
1,815 |
GDDR6 |
8,192 |
15,500 |
256 |
6+8 |
456.16 |
|
| Nvidia GeForce RTX 2080 Founders Edition | 2,944 |
1,515 |
1,800 |
GDDR6 |
8,192 |
14,000 |
256 |
6+8 |
456.16 |
|
| Nvidia GeForce RTX 2070 Super Founders Edition | 2,560 |
1,605 |
1,770 |
GDDR6 |
8,192 |
14,000 |
256 |
6+8 |
456.16 |
|
| Nvidia GeForce GTX 1080 Ti Founders Edition | 3,584 |
1,481 |
1,582 |
GDDR5X |
8,192 |
11,000 |
352 |
6+8 |
456.16 |
|
HEXUS 2020 Test Platform |
||
|---|---|---|
| Component | Product Page | |
| Processor | AMD Ryzen 9 3950X | amd.com |
| Motherboard | Asus ROG Crosshair VIII Formula | asus.com |
| CPU Cooler | Corsair Hydro Series H150i Pro RGB | corsair.com |
| Memory | G.Skill Trident Z Neo DDR4-3200 (2x16GB) | gskill.com |
| Storage | 2TB Corsair MP600 | corsair.com |
| Power Supply | be quiet! Straight Power 11 Platinum 1,000W | bequiet.com |
| Network Card | Asus XG-C100C 10GBase-T PCIe Adapter | asus.com |
| Chassis | Fractal Design Define 7 Clear Tempered Glass | fractal-design.com |
| Monitor | Philips Momentum 436M6VBPAB | philips.co.uk |
| Keyboard | Corsair K70 RGB MK.2 Low Profile Rapidfire | corsair.com |
| Mouse | Corsair Ironclaw RGB | corsair.com |
| Operating System | Microsoft Windows 10 Pro | microsoft.com |
Benchmark Suite |
||
|---|---|---|
| Synthetic Benchmarks | ||
| 3DMark | Time Spy, Time Spy Extreme, Time Spy Extreme Stress Test | |
| Gaming Benchmarks and Settings | ||
| Borderlands 3 | DX12, TAA, Badass Quality | |
| Civilization VI: Gathering Storm | DX11, 4xMSAA, Ultra Quality | |
| Far Cry: New Dawn | DX11, TAA, HD Textures Enabled, HDR10, Ultra Quality | |
| Forza Horizon 4 | DX12, 8xMSAA, Maximum Quality | |
| Gears 5 | DX12, TAA, Ultra Textures Enabled, Ultra Quality | |
| Shadow of the Tomb Raider | DX12, TAA, Highest Quality | |
| GPGPU Benchmarks | ||
| AIDA64 | AES-256 Encryption Test | |
| IndigoBench | Standalone benchmark application based on Indigo 4's advanced rendering engine | |
| Ray Tracing Benchmarks | ||
| 3DMark Port Royal | Run at default resolution on hardware ray tracing-capable cards | |
| 3DMark DXR Feature Test | Run at default resolution on hardware ray tracing-capable cards | |
| Control | DX12, High Quality, Ray Tracing High | |
| General Benchmarks | ||
| Power Consumption | To emulate real-world usage scenarios, we record system-wide mains power draw when idle and while playing Gears 5 | |
| Temperature | To emulate real-world usage scenarios, we record GPU core temperature when idle and while playing Gears 5 | |
| Noise | A PCE-318 meter is used to record noise levels when idle and while playing Gears 5 | |


