


Test Methodology
EVGA GeForce GTX 1080 Ti SC2 Gaming |
|---|
 |
GPU Comparisons |
|||||||||
|---|---|---|---|---|---|---|---|---|---|
GPU |
Memory |
Miscellaneous |
|||||||
Cores |
Base (MHz) |
Boost (MHz) |
Size (MB) |
Clock (MHz) |
Bus (bits) |
Power Config |
Driver |
||
| Aorus GeForce GTX 1080 Ti Xtreme Edition | 3,584 | 1,607 | 1,721 | 11,264 | 11,232 | 352 | 8+8 | 378.78 | |
| Asus ROG Strix GeForce GTX 1080 Ti OC | 3,584 | 1,569 | 1,683 | 11,264 | 11,008 | 352 | 8+8 | 378.78 | |
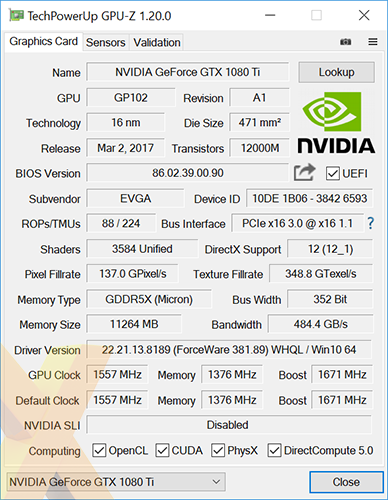
| EVGA GeForce GTX 1080 Ti SC2 Gaming | 3,584 | 1,556 | 1,670 | 11,264 | 11,008 | 352 | 6+8 | 381.89 | |
| MSI GeForce GTX 1080 Ti Gaming X | 3,584 | 1,544 | 1,658 | 11,264 | 11,008 | 352 | 8+8 | 381.89 | |
| Nvidia GeForce GTX 1080 Ti | 3,584 | 1,481 | 1,582 | 11,264 | 11,008 | 352 | 6+8 | 378.78 | |
| Nvidia Titan X | 3,584 | 1,418 | 1,531 | 12,288 | 10,008 | 384 | 6+8 | 378.78 | |
| EVGA GeForce GTX 1080 FTW | 2,560 | 1,721 | 1,860 | 8,192 | 10,008 | 256 | 6+8 | 378.78 | |
| MSI GeForce GTX 1080 Gaming X Plus | 2,560 | 1,683 | 1,823 | 8,192 | 11,008 | 256 | 6+8 | 378.78 | |
| AMD Radeon R9 Fury X | 4,096 | - | 1,050 | 4,096 | 1,000 | 4,096 | 8+8 | 17.2.1 | |
HEXUS Graphics Test Bench |
||
|---|---|---|
| Hardware Components | Product Page | |
| Processor | Intel Core i7-6700K (overclocked to 4.4GHz) | intel.com |
| CPU Cooler | Noctua NH-D15S | noctua.at |
| Motherboard | Asus Z170 Pro | asus.com |
| Memory | Crucial Ballistix Sport LT 32GB (2x16GB) DDR4-2400 | crucial.com |
| Power Supply | be quiet! Dark Power Pro 11 850W | bequiet.com |
| Primary Storage | 256GB Samsung 950 Pro | samsung.com |
| Secondary Storage | 512GB SK hynix Canvas SC300 | skhynix.com |
| Chassis | Fractal Design Define R5 Windowed | fractal-design.com |
| Monitor | Philips Brilliance 4K Ultra HD LED (288P6LJEB/00) | philips.co.uk |
| Operating system | Windows 10 (64-bit) | microsoft.com |
Benchmark Suite |
||
|---|---|---|
| Synthetic Benchmarks | ||
| 3DMark | Fire Strike, Fire Strike Extreme, Fire Strike Ultra, Time Spy and Time Spy Stress Test | |
| VRMark | Orange Room and Blue Room | |
| Gaming Benchmarks and Settings | ||
| Deus Ex: Mankind Divided | DX12, TAA, Ultra Quality | |
| Doom | Vulkan, TSSAA (8TX), Ultra Quality | |
| Gears of War 4 | DX12, TAA, Ultra Quality | |
| Hitman | DX12, SMAA, Ultra Quality | |
| Rise of the Tomb Raider | DX12, SMAA, Very High Quality | |
| Total War: Warhammer | DX12, FXAA, Ultra Quality | |
| General Benchmarks | ||
| Power Consumption | To emulate real-world usage scenarios, we record system-wide mains power draw both when idle and while playing Gears of War 4. | |
| Temperature | To emulate real-world usage scenarios, we record GPU core temperature both when idle and while playing Gears of War 4. | |
| Noise | A PCE-318 meter is used to record noise levels when idle and while playing Gears of War 4. | |
| Overclocking | Maintaining out-the-box voltage, we increase the card's power target and aim for an optimal balance of core and memory overclock. | |
Notes
To minimise the impact of any CPU bottlenecks, our test platform is configured with a quad-core Intel Core i7-6700K processor overclocked to 4.4GHz across all cores and 32GB of Crucial Ballistix Sport LT DDR4 memory set to run at 2,400MHz using the built-in XMP profile.
For our high-end benchmark suite, we have an array of games tested at FHD (1,920x1,080), QHD (2,560x1,440) and 4K UHD (3,840x2,160) resolutions. Where applicable, any vendor-specific enhancements such as PhysX and TressFX are disabled to help even the playing field. In-game benchmark results are recorded as average frames per second and minimum fps is included where available.


