


Testing Methodology
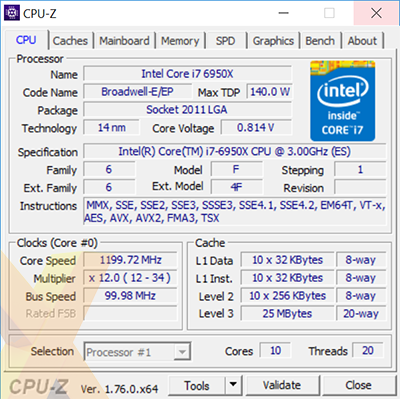
Intel Core i7-6950X Specification |
|---|
 |
Comparison Processor Configurations |
|||
|---|---|---|---|
| CPU | Intel |
||
Core i7-6950X |
Core i7-5960X |
Core i7-6700K |
|
| CPU Base Clock | 3.0GHz |
3.0GHz |
4.0GHz |
| CPU Turbo Clock | 3.5GHz |
3.5GHz |
4.2GHz |
| CPU Cache | 25MB |
20MB |
8MB |
| CPU Cores / Threads | 10 / 20 |
8 / 16 |
4 / 8 |
| CPU TDP | 140W |
140W |
91W |
| Integrated Graphics | NA |
NA |
HD 530 |
| IGP Base Clock | NA |
NA |
300MHz |
| IGP Turbo Clock | NA |
NA |
1.15GHz |
| Socket | LGA 2011 v3 |
LGA 2011 v3 |
LGA 1151 |
| Lithography | 22nm |
22nm |
14nm |
| Motherboard | Asus X99 Strix Gaming |
Gigabyte X170XP-SLI |
|
| BIOS | 0401 |
F6h |
|
| Memory | Corsair Vengeance LPX 16GB DDR4 (4x4GB) |
Corsair Vengeance 16GB DDR3 (2x8GB) |
|
| Memory Timings | 16-16-16-39-2T @ 2,400MHz |
16-16-16-39-2T @ 2,133MHz |
15-15-15-36-2T @ 2,133MHz |
| Disk Drive | SK hynix Canvas SC300 (512GB) |
||
| Power Supply | be quiet Dark Power Pro 11 (800W) |
||
| CPU Cooler | Noctua NH-D15 |
||
| Operating System | Microsoft Windows 10 (64-bit) |
||
Benchmark Suite |
||||||||||||
|---|---|---|---|---|---|---|---|---|---|---|---|---|
| CPU Benchmarks | ||||||||||||
| HEXUS PiFast | Our number-crunching benchmark stresses a single core by calculating Pi to 10m places | |||||||||||
| Cinebench R15 | Using Cinebench's multi-CPU render, this cross-platform benchmark stresses all cores | |||||||||||
| wPrime 2.1.0 | Another number-crunching benchmark that stresses all available CPU cores/threads | |||||||||||
| HandBrake 0.10.5 | Free-to-use video encoder that stresses all CPU cores (64-bit) | |||||||||||
| Memory Benchmarks | ||||||||||||
| AIDA64 v5.70.3849 | Benchmark that analyses memory bandwidth and latency | |||||||||||
| Gaming Benchmarks (GeForce GTX 1080) | ||||||||||||
| 3DMark | Graphics test run using the Fire Strike, Fire Strike Extreme and Fire Strike Ultra presets | |||||||||||
| Dirt Rally | 1,920x1,080, 2,560x1,440 and 3,840x2,160, Ultra Preset | |||||||||||
| Rise of the Tomb Raider (DX12) | 1,920x1,080, 2,560x1,440 and 3,840x2,160, Very High Preset | |||||||||||
| Tom Clancy's The Division | 1,920x1,080, 2,560x1,440 and 3,840x2,160, Ultra Preset | |||||||||||
| Miscellaneous Benchmarks | ||||||||||||
| Power Consumption | To emulate real-world usage scenarios, we record system-wide mains power draw when idle, when encoding video via HandBrake and while playing Rise of the Tomb Raider | |||||||||||
Notes
We're comparing the Core i7-6950X's performance against the chip it replaces as the Intel consumer head honcho, the Core i7-5960X. The popular Core i7-6700K, considered the best of the mainstream quad-core breed, has also been benchmarked from scratch to provide meaningful numbers.
We've taken the opportunity to tweak the benchmarks and add the GeForce GTX 1080 , and new games, into the mix. Those looking for a comparison against a wider set of CPUs simply need to head on over to here to learn more.


