Testing methodology and notes
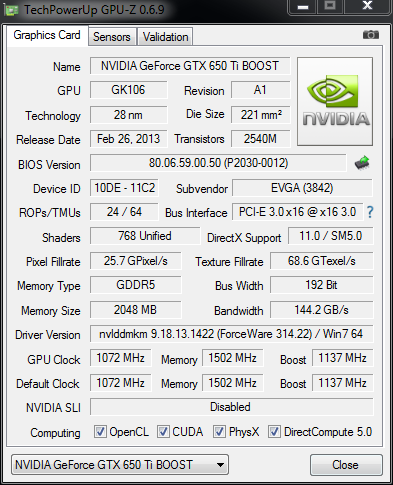
EVGA GeForce GTX 650 Ti Boost SC spec |
|---|
 |
GPU Comparisons |
||||||||
|---|---|---|---|---|---|---|---|---|
| Graphics Card | GPU Clock (MHz) |
Stream Processors |
Shader Clock (MHz) |
Memory Clock (MHz) |
Memory Bus (bits) |
Graphics Driver | Approx Price | |
| NVIDIA GeForce GTX 660 2GB | 980 (1,033) | 960 | 980 (1,033) | 6,008 | 192 | GeForce 314.21 | £150 | |
| EVGA GeForce GTX 650 Ti Boost SC 2GB | 1,072 (1,137) | 768 | 1,072 (1,137) | 6,008 | 192 | GeForce 314.22 | £150 | |
| Palit GeForce GTX 650 Ti Boost 2GB | 1,006 (1,072) | 768 | 1,006 (1,072) | 6,108 | 192 | GeForce 314.22 | £140 | |
| NVIDIA GeForce GTX 650 Ti Boost 2GB | 980 (1,033) | 768 | 980 (1,033) | 6,000 | 192 | GeForce 314.21 | £130 | |
| NVIDIA GeForce GTX 650 Ti 1GB | 928 | 768 | 928 | 5,400 | 128 | GeForce 314.21 | £110 | |
| NVIDIA GeForce GTX 560 1GB | 900 | 336 | 1,800 | 4,000 | 256 | GeForce 314.21 | £140 | |
| AMD Radeon HD 7850 1GB | 860 | 1,024 | 860 | 4,800 | 256 | Catalyst 13.3 | £125 | |
| Sapphire Radeon HD 7790 Dual-X OC 1GB | 1,075 | 896 | 1,075 | 6,400 | 128 | Catalyst 13.3 | £130 | |
| Gigabyte Radeon HD 7790 OC 1GB | 1,075 | 896 | 1,075 | 6,000 | 128 | Catalyst 13.3 | £125 | |
| AMD Radeon HD 7790 1GB | 1,000 | 896 | 1,075 | 6,000 | 128 | Catalyst 13.3 | £120 | |
| AMD Radeon HD 7770 1GB | 1,000 | 640 | 1,000 | 4,500 | 128 | Catalyst 13.3 | £90 | |
HEXUS Graphics Test Bench |
||||||||||||
|---|---|---|---|---|---|---|---|---|---|---|---|---|
| Processor | Intel Core i7-3770K (3.50GHz, 8MB cache, quad-core) | |||||||||||
| CPU Cooler | Intel reference E97378-001 | |||||||||||
| Motherboard | Gigabyte GA-Z77X-UP4 TH | |||||||||||
| Memory | 8GB G.Skill RipJaws (2x4GB) DDR3 @ 1,600MHz | |||||||||||
| Power Supply | Corsair AX750W | |||||||||||
| Storage Device | Samsung 830 Series 256GB SSD | |||||||||||
| Optical Drive | Generic 24x DVD-RW | |||||||||||
| Chassis | Corsair Graphite Series 600T | |||||||||||
| Monitor | BenQ 24in EW2430 (1,920x1,080) | |||||||||||
| Operating system | Windows 7 Ultimate (64-bit, SP1) | |||||||||||
HEXUS Mid-Range Benchmarking Suite |
||
|---|---|---|
| 3D Benchmarks | Mode and Resolutions | Quality Settings |
| 3DMark | DX11 | Fire Strike and Cloud Gate |
| Call of Duty: Black Ops 2 | DX9 at 1,680x1,050 and 1,920x1,080 | 4xMSAA, High |
| Crysis 3 | DX11 at 1,680x1,050 and 1,920x1,080 | 2xMSAA, Medium |
| DiRT Showdown | DX11 at 1,680x1,050 and 1,920x1,080 | 4xMSAA, High |
| Far Cry 3 | DX11 at 1,680x1,050 and 1,920x1,080 | 2xMSAA, High |
| Just Cause 2 | DX10 at 1,680x1,050 and 1,920x1,080 | 4xMSAA, High |
| General Benchmarks | Description | |
| Power Consumption | To emulate real-world usage scenarios, we record mains power draw both when idle and while playing Far Cry 3 | |
| Temperature | To emulate real-world usage scenarios, we record GPU core temperature both when idle and while playing Far Cry 3 | |
| Noise | A PCE-318 meter is used to record noise levels when idle and while playing Far Cry 3 | |
Testing notes
EVGA's SuperClocked card is about as good as a GTX 650 Ti Boost 2GB is going to get. It still gives away a healthy amount of compute muscle when compared to a GTX 660, now available for the same money, so let's see how it all pans out.


