Benchmarks I
|
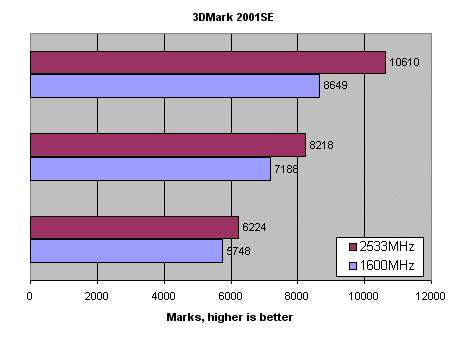
The following benchmarks are simply run with the default card clocks (250/500), the only difference is the speed of the host processor. I want to illustrate just how potent the CPU is in the overall performance picture. I'll also include some overclocked benchmarks later. We'll have 1024x768x32 at the top, 1280x1024x32 in the middle, and 1600x1200x32 at the bottom of the following graphs.
What you see here is surprising. 3DMark 2001SE isn't a game in itself but your overall score is a reasonable indicator of your PC's ability to play current games. Anything over 6000, at the default resolution of 1024x768x32, usually means you can play most of today's games. The fact that you gain around 2000 marks, or around 23% extra performance, at 1024x768x32, speaks volumes for the need of a fast host processor, especially when complex geometry is involved. This shows just how well the Siluro Ti 4200 scales in this particular test. Naturally, the scores converge as the tests become more card-limited at higher resolutions.
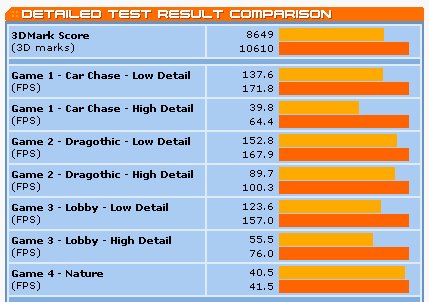
The individual breakdown, at 1024x768x32, shows us that benchmarks with a huge amount of geometry (car and lobby tests) gain enormously from a CPU speed increase. Tests that are heavy on the GPU (Dragothic and Nature) are largely unaffected. |