


Test methodology
We're comparing Inno3D's pre-overclocked card with a complete range of mid-to-high-end cards from both AMD and NVIDIA.
The numbers suggest the card will fit in between the stock-clocked ZOTAC GTX 460 and the heavily-overclocked KFA2 model, but what's interesting is that the souped-up KFA2 GTX 460 LTD OC has fallen in price to an Inno3D-matching £185.
Bang4buck will favour the former, whilst the latter will have to rely on power consumption and noise being the deciding factors.
A complete breakdown of our comparison GPUs, test bench and benchmarks can be found below.
GPU comparisons |
||||||||
|---|---|---|---|---|---|---|---|---|
| Graphics cards | Current pricing | Shader model | Stream processors | GPU clock speed (MHz) | Shader clock speed (MHz) | Memory clock speed (MHz) | Memory bus width (bits) | Graphics driver |
| ZOTAC GeForce GTX 480 1,536MB | £360 | 5.0 | 480 | 700 | 1,401 | 3,698 | 384 | ForceWare 258.80 |
| ZOTAC GeForce GTX 470 1,280MB | £240 | 5.0 | 448 | 607 | 1,215 | 3,348 | 320 | ForceWare 258.80 |
| ASUS GeForce GTX 465 1,024MB | £190 | 5.0 | 352 | 607 | 1,215 | 3,208 | 256 | ForceWare 258.80 |
| ZOTAC GeForce GTX 460 SLI 1,024MB | £360 | 5.0 | 336 (x2) | 675 | 1,350 | 3,600 | 256 (x2) | ForceWare 258.80 |
| EVGA GeForce GTX 460 SC SLI 768MB | £360 | 5.0 | 336 (x2) | 763 | 1,526 | 3,800 | 192 (x2) | ForceWare 258.80 |
| KFA2 GeForce GTX 460 LTD OC 1,024MB | £185 | 5.0 | 336 | 810 | 1,620 | 4,000 | 256 | ForceWare 258.80 |
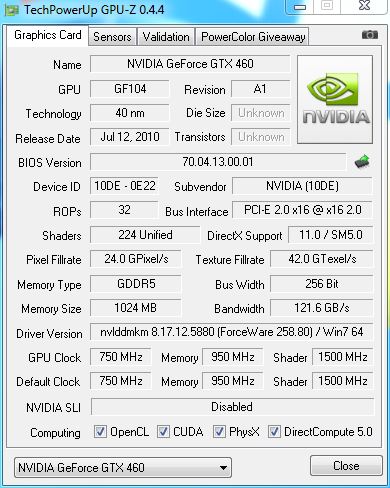
| Inno3D GeForce GTX 460 OC 1,024MB | £185 | 5.0 | 336 | 750 | 1,500 | 3,800 | 256 | ForceWare 258.80 |
| ZOTAC GeForce GTX 460 1,024MB | £180 | 5.0 | 336 | 675 | 1,350 | 3,600 | 256 | ForceWare 258.80 |
| EVGA GeForce GTX 460 768MB | £165 | 5.0 | 336 | 675 | 1,350 | 3,600 | 192 | ForceWare 258.80 |
| Sapphire Radeon HD 5850 XF 1,024MB | £470 | 5.0 | 1,440 (x2) | 725 | 725 | 4,000 | 256 (x2) | Catalyst 10.6 |
| HIS Radeon HD 5870 1,024MB | £335 | 5.0 | 1,600 | 850 | 850 | 4,800 | 256 | Catalyst 10.6 |
| Sapphire Radeon HD 5850 1,024MB | £235 | 5.0 | 1,440 | 725 | 725 | 4,000 | 256 | Catalyst 10.6 |
| Sapphire Radeon HD 5830 1,024MB | £170 | 5.0 | 1,120 | 800 | 800 | 4,000 | 256 | Catalyst 10.6 |
Test bench |
||||||||||||
|---|---|---|---|---|---|---|---|---|---|---|---|---|
| CPU | Intel Core i7 965 Extreme Edition (3.20GHz, 8MB L3 cache, quad-core, LGA1366 - Turbo Boost enabled) | |||||||||||
| Motherboard | ASUS P6X58D Premium | |||||||||||
| Motherboard BIOS | 0808 | |||||||||||
| Memory | 6GB Corsair DDR3 | |||||||||||
| Memory timings and speed | 9-9-9-24-1T @ DDR3-1,600 | |||||||||||
| PSU | Corsair HX1000W | |||||||||||
| Monitor | Dell 30in 3007WFP - 2,560x1,600px | |||||||||||
| Disk drive(s) | Corsair Nova V128 SSD | |||||||||||
| Operating system | Windows 7 Ultimate, 64-bit | |||||||||||
Benchmarks |
||||||||||||
|---|---|---|---|---|---|---|---|---|---|---|---|---|
| Aliens vs. Predator | DX11, 1,680x1,050, 1,920x1,080 and 2,560x1,600 resolutions, 2xAA, 8xAF, very high quality. | |||||||||||
| Battlefield: Bad Company 2 | DX11, 1,680x1,050, 1,920x1,080 and 2,560x1,600 resolutions, 4xAA, 16xAF, ultra quality, FRAPS-recorded benchmark. | |||||||||||
| Call of Duty: Modern Warfare 2 | DX9, 1,680x1,050, 1,920x1,080 and 2,560x1,600 resolutions, 4xAA, ultra quality, FRAPS-recorded benchmark. | |||||||||||
| Crysis Warhead | DX10, 1,680x1,050, 1,920x1,080 and 2,560x1,600 resolutions, 4xAA, gamer quality, Frost map, FRAPS-recorded benchmark. | |||||||||||
| DiRT 2 | DX11, 1,680x1,050, 1,920x1,080 and 2,560x1,600 resolutions, 4xAA, ultra quality, London map. | |||||||||||
| Temperature | To emulate real-world usage scenarios, we record GPU core temperature both when idle and whilst playing Crysis Warhead. And, for a worst-case scenario, we throw in numbers from the Furmark stress test. | |||||||||||
| Power consumption | To emulate real-world usage scenarios, we record mains power draw both when idle and whilst playing Crysis Warhead. And, for a worst-case scenario, we throw in numbers from the Furmark stress test. | |||||||||||
| Noise | Albeit not scientific, we use the tried-and-trusted human ear to share an opinion on GPU noise. | |||||||||||


