Test Methodology
MSI GeForce RTX 3080 Gaming X Trio |
|---|
 |
GPU Comparisons |
||||||||||
|---|---|---|---|---|---|---|---|---|---|---|
GPU |
Memory |
Miscellaneous |
||||||||
Cores |
Base (MHz) |
Boost (MHz) |
Type |
Size (MB) |
Clock (MHz) |
Bus (bits) |
Power Config |
Driver |
||
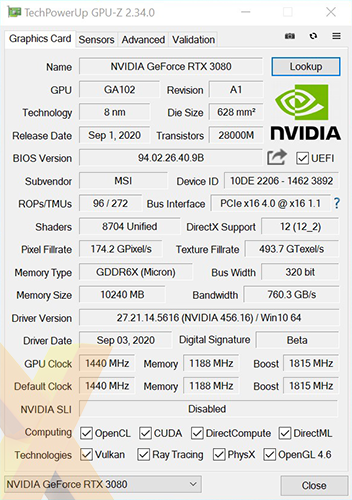
| MSI GeForce RTX 3080 Gaming X Trio | 8,704 |
1,440 |
1,815 |
GDDR6X |
10,240 |
19,000 |
320 |
8+8+8 |
456.16 |
|
| Asus GeForce RTX 3080 TUF Gaming OC | 8,704 |
1,440 |
1,785 |
GDDR6X |
10,240 |
19,000 |
320 |
8+8 |
456.16 |
|
| Nvidia GeForce RTX 3080 Founders Edition | 8,704 |
1,440 |
1,710 |
GDDR6X |
10,240 |
19,000 |
320 |
12 |
456.16 |
|
| Nvidia GeForce RTX 2080 Ti Founders Edition | 4,352 |
1,350 |
1,635 |
GDDR6 |
11,264 |
14,000 |
352 |
8+8 |
456.16 |
|
| Nvidia GeForce RTX 2080 Super Founders Edition | 3,072 |
1,650 |
1,815 |
GDDR6 |
8,192 |
15,500 |
256 |
6+8 |
456.16 |
|
| Nvidia GeForce RTX 2080 Founders Edition | 2,944 |
1,515 |
1,800 |
GDDR6 |
8,192 |
14,000 |
256 |
6+8 |
456.16 |
|
| Nvidia GeForce RTX 2070 Super Founders Edition | 2,560 |
1,605 |
1,770 |
GDDR6 |
8,192 |
14,000 |
256 |
6+8 |
456.16 |
|
| Nvidia GeForce GTX 1080 Ti Founders Edition | 3,584 |
1,481 |
1,582 |
GDDR5X |
8,192 |
11,000 |
352 |
6+8 |
456.16 |
|
| AMD Radeon RX 5700 XT | 2,560 |
1,605 |
1,905 |
GDDR6 |
8,192 |
14,000 |
256 |
6+8 |
20.8.3 |
|
| AMD Radeon RX 5700 | 2,304 |
1,465 |
1,725 |
GDDR6 |
8,192 |
14,000 |
256 |
6+8 |
20.8.3 |
|
HEXUS 2020 Test Platform |
||
|---|---|---|
| Component | Product Page | |
| Processor | AMD Ryzen 9 3950X | amd.com |
| Motherboard | Asus ROG Crosshair VIII Formula | asus.com |
| CPU Cooler | Corsair Hydro Series H150i Pro RGB | corsair.com |
| Memory | G.Skill Trident Z Neo DDR4-3200 (2x16GB) | gskill.com |
| Storage | 2TB Corsair MP600 | corsair.com |
| Power Supply | be quiet! Straight Power 11 Platinum 1,000W | bequiet.com |
| Network Card | Asus XG-C100C 10GBase-T PCIe Adapter | asus.com |
| Chassis | Fractal Design Define 7 Clear Tempered Glass | fractal-design.com |
| Monitor | Philips Momentum 436M6VBPAB | philips.co.uk |
| Keyboard | Corsair K70 RGB MK.2 Low Profile Rapidfire | corsair.com |
| Mouse | Corsair Ironclaw RGB | corsair.com |
| Operating System | Microsoft Windows 10 Pro | microsoft.com |
Benchmark Suite |
||
|---|---|---|
| Synthetic Benchmarks | ||
| 3DMark | Time Spy, Time Spy Extreme, Time Spy Extreme Stress Test | |
| Gaming Benchmarks and Settings | ||
| Borderlands 3 | DX12, TAA, Badass Quality | |
| Civilization VI: Gathering Storm | DX11, 4xMSAA, Ultra Quality | |
| Far Cry: New Dawn | DX11, TAA, HD Textures Enabled, HDR10, Ultra Quality | |
| Forza Horizon 4 | DX12, 8xMSAA, Maximum Quality | |
| Gears 5 | DX12, TAA, Ultra Textures Enabled, Ultra Quality | |
| Shadow of the Tomb Raider | DX12, TAA, Highest Quality | |
| General Benchmarks | ||
| Power Consumption | To emulate real-world usage scenarios, we record system-wide mains power draw when idle and while playing Gears 5 | |
| Temperature | To emulate real-world usage scenarios, we record GPU core temperature when idle and while playing Gears 5 | |
| Noise | A PCE-318 meter is used to record noise levels when idle and while playing Gears 5 | |
Notes
RTX 3080 review cards are arriving thick and fast. Partner cards from Asus and MSI are the first to feature in our charts alongside the Founders Edition. 10 listed cards are benchmarked from the ground up on our AMD Ryzen 3950X test platform using the latest available drivers. Note that reviews of partner cards are focussed purely on rasterisation performance, analysis of ray-tracing and GPGPU performance can be found in our initial RTX 3080 analysis.


