


HEXUS.Bang4Buck
HEXUS.bang4buck
In a rough-and-ready assessment of the cards' bang per buck, we've aggregated the 1,280x1,024/720 frame-rates for the three games, normalised them* and taken account of listed the cards' prices.
But there are more provisos than we'd care to shake a stick at. We could have chosen three different games, the cards' prices could have been derived from other sources and pricing tends to fluctuate daily.
Consequently, the table and graph below highlight a metric that should only be used as a yardstick for evaluating comparative performance with price factored in. Other architectural benefits are not covered, obviously.
| Graphics cards |
ECS N8800GT-512MX DT |
Palit 8800GT 512MB Sonic | 8800GT 512MB Reference Clocks | Inno3D GeForce 9600 GT OC 512MiB | Sapphire Radeon HD 3850 1GB | Sapphire Radeon HD 3870 Ultimate |
|---|---|---|---|---|---|---|
| Actual aggregate marks at 1,280x1,024/720 | 281.84 | 281.69 | 266.07 | 230.33 | 191.19 |
208.27 |
| Aggregate marks, normalised*, at 1,280x1,024/720 | 229.88 | 229.67 | 218.46 | 190.51 | 162.68 |
173.84 |
| Current price | £140 | £140 | £105 | £105 | £120 |
£113 |
| HEXUS.bang4buck score at 1,280x1,024/720 | 1.64 | 1.64 | 2.08 | 1.81 | 1.356 |
1.54 |
| Acceptable frame rate (av. 60fps) at 1,280x1,024/720 | No (CoH DX10) | No (CoH DX10) | No (CoH DX10) | No (CoH DX10) | No (CoH DX10) | No (CoH DX10) |
* The normalisation refers to taking playable frame rate into account. Should a card benchmark at over 60 frames per second in any one game, the extra fps count as half. Similarly, should a card benchmark lower, say at 40fps, we deduct half the difference from its average frame rate and the desired 60fps, giving it a bang4buck score of 30 marks. The minimum allowable frame rate is 20fps but that scores zero.
As an example, should a card score 120fps we treat it as 90fps as only half the frame rate above 60fps is counted for the bang4buck - this is the formula: (120-((120-60)/2)). Similarly, should it score 30fps, we count it as only 15fps: (30+((30-60)/2)).
The reasoning behind such calculation lies with playable frame rates.
Should card A score 110fps in a benchmark and card B 160, then card B would otherwise receive an extra 50 marks in our bang4buck assessment, even though both cards produce perfectly playable frame rates and anything above 60fps is a bonus and not a necessity for most.
Similarly, without our adjustments, the aggregated bang4buck total for two very different cards would be identical if, in a further benchmark, card A scored a smooth 70fps and card B an unplayable 20fps. Both would win marks totally 180, yet the games-playing experience would be vastly different.
A more realistic (and useful) assessment would say that card A is better because it ran smoothly in both games - and that view would be accurately reflected in our adjusted aggregation, where card A would receive 150 marks (85+65) and card B 100 (100+0).
In effect, we're including a desired average frame rate, in this case 60, and penalising lower performance while giving frame rates higher than 60fps only half as much credit as those up to 60fps. If this doesn't make sense or you have issue with it, please hit the HEXUS community.
Here's the HEXUS.bang4buck graph at 1,280x1,024/720.
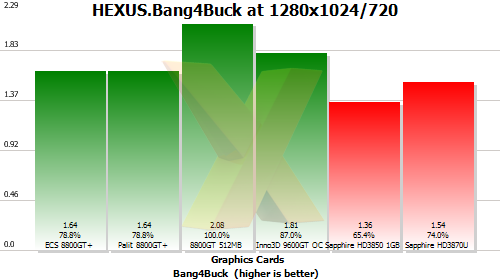
The graph divides the normalised score by the price.
Both the ECS and the Palit pre-overclocked 8800GT cards receive very respectable HEXUS.bang4buck ratings, offering better value-for-money than either of the two special-edition ATI cards tested.
The Inno3D 9600GT OC, whilst offering less performance, is able to offer greater HEXUS.bang4buck by significantly undercutting the pre-overclocked 8800GTs on price.
The real star, however, is the simulated, reference-clocked GeForce 8800 GT, which offers most of the performance of its overclocked brethren whilst costing the same as the 9600GT OC. It would seem that the price premium charged for the pre-overclocked cards cannot be justified solely by meagre performance increases
Neither ATI card fares particularly well here, with the HD 3850 1GiB demanding the second-highest asking price whilst performing the poorest of the cards on test. The Sapphire HD 3870 ULTIMATE suffers from an increase in cost over reference designs but with no increase in performance, although it does offer a passively-cooled graphics solution that can offer an enjoyable gameplay experience for far less than the ECS 8800 GT, even if absolute performance isn't as good.
For reference, a £95 HD 3870 512MiB would have a HEXUS.bang4buck rating of 1.83 - offering, as we know, the same performance as Sapphires HD 3870 ULTIMATE but at a lower price by foregoing the more-expensive passive-cooling solution. Got all that?
Temperature musings
We perform our testing in an open test bed, with a 120mm fan simulating case airflow. Taking that into account, the load temperature of both passive solutions could rise significantly further in a chassis without decent ventilation. As such the temperatures provided for the ECS N8800GT-512MX DT and Sapphire Radeon HD 3870 Ultimate should be considered in light of what is an optimal testing environment, and comparable to a well ventilated case.
| Graphics cards | ECS N8800GT-512MX DT | Palit 8800GT 512MB Sonic | Inno3D GeForce 9600 GT OC 512MB | Sapphire Radeon HD 3850 1GiB | Sapphire Radeon HD 3870 ULTIMATE |
|---|---|---|---|---|---|
| Ambient temperature | 22.5°C | 22°C | 19.5°C | 22°C | 22.5°C |
| Idle temperature | 44°C | 47°C | 39°C | 41°C | 46°C |
| Load temperature | 57°C | 60°C | 61°C | 66°C | 70°C |
| Ambient-to-load delta | 35°C | 38°C | 41.5°C | 44°C | 47.5°C |
The ECS cooler, even when run in passive mode, is better able to cool the 8800 GT than the Palit's active cooler - at least in a well-ventilated system, as noted above. Both 8800 GT coolers prove themselves to be very effective, offering the two lowest ambient-to-load deltas amongst the tested cards.
Overclocking.
We managed to overclock the ECS card on passive cooling to a requested 705MHz (702MHz reported) core clock, 1,757MHz (1,782MHz reported) shader clock, and 1,015MHz (2,030MHz effective) memory clock. These figures represent overclocks of 8.4% core, 10% shader and 6.8% memory over the already higher-than-reference clock speeds.
This resulted in a 6.8% performance in Quake: Enemy Territory at 1680x1050 with 4xAA/16xAF. The correlation between memory overclock and performance increase indicates that it was memory bandwidth holding back performance, rather than shader performance, which lines up with our previous testing, comparing the GeForce 9800 GTX and 8800 Ultra, where the Ultra’s additional memory bandwidth gave it an advantage in this game, despite the 9800 GTX’s additional shader performance.In such situations there will be little performance difference between an 8800 GT and a similarly-clocked 8800 GTS 512, as the additional shader power will be held back by the same memory bandwidth bottleneck. Games that are less bandwidth reliant may garner more of a performance boost from the overclocks observed.
It’s also important to note that these tests were performed without the active cooling installed, and, as such, greater overclocks could be expected with the module installed - particularly for the memory which is reliant on small heatsinks for their cooling, rather than the vast surface area the AC Accelero S1 affords the core.The Palit card overclocked to 745/1,862/2,190MHz, which, clearly, is better than the ECS'.. This resulted in a 13% performance increase in Quake: Enemy Territory, which would indicate that the bottleneck shifts from the memory bandwidth to shader power for the card. The memory overclock is particularly impressive, and the core and shader overclocks are better than average for a GeForce 8800 GT 512MiB card. Whether this is due to the cooler, speed-binning for the higher-than-reference-clocked SKU or a combination of the two, the performance speaks for itself.


