Overclocking examination
OverclockingOverclocking tests were carried out by testing each setting with a loop of 3DMark2001SE. The table below summarises the findings.
| Speed | Voltage (under load) | Result |
| 1833MHz | 1.45v | Pass (as expected) |
| 1900MHz | 1.45v | Pass |
| 2000MHz | 1.45v | Pass |
| 2100MHz | 1.45v | Pass |
| 2150MHz | 1.45v | Fail |
| 2150MHz | 1.55v | Pass |
| 2200MHz | 1.55v | Pass |
| 2250MHz | 1.55v | Fail |
| 2250MHz | 1.65v | Pass |
| 2300MHz | 1.65v | Pass |
| 2350MHz | 1.65v | Fail |
| 2350MHz | 1.725v | Pass |
| 2400MHz | 1.725v | Fail |
| 2400MHz | 1.8v | Pass (but very getting hot) |
| 2450MHz | 1.8v | Fail |
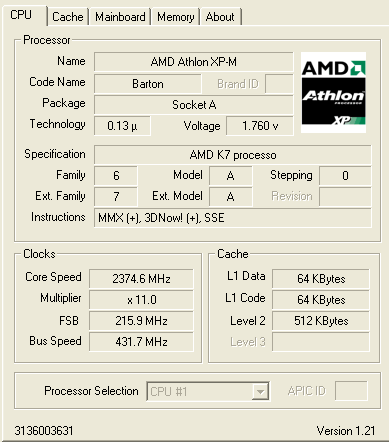
2.1GHz with 1.45v load voltage is impressive performance. Core headroom rears its ugly head any speed much above 2.3GHz. We reckon that serious air cooling would stabilise the test CPU at close to 2.5GHz. For the overclocked tests we chose a final, stable speed of 2375MHz.

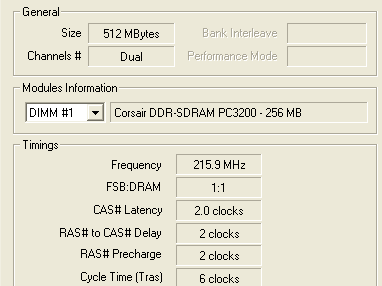
2.375GHz required a load voltage of around 1.75v. However, it must be noted that it never crashed once in our battery of tests. We decided to increase the FSB to reflect an overclocked system. The use of some excellent Corsair RAM guaranteed low-latency timings.

Near-2.4GHz speed from a mobile CPU that initially booted at 800MHz and costs around £70. There's life in the K7 dog yet.
The XP-M Barton was subjected to our regular CPU-testing suite, both in standard (1.833GHz/166MHz FSB) and overclocked forms. We've thrown in a Celeron 2.8GHz, Pentium 4 2.4GHz HT, P4 3.0GHz HT, and Athlon 64 Model 3000+ processors into the benchmark mix, and all were run at their respective stock speeds.


