Benchmarks: IGP - Part One

| Intel Core i7-4770K Performance Gain/Loss |
Intel Core i7-3770K | Intel Core i7-2700K | AMD A10-5800K |
|---|---|---|---|
| + 41.3% | + 180.4% | + 11.0% |
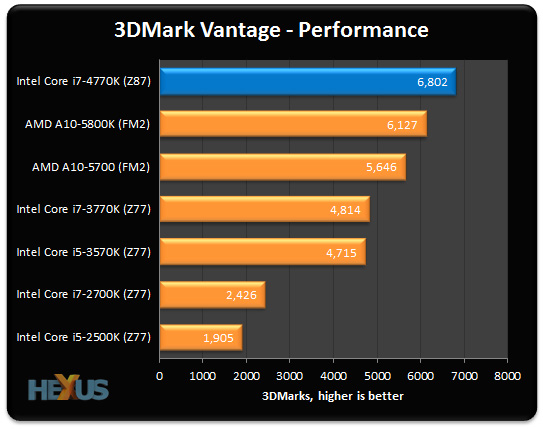
3DMark Vantage provides a good overview of combined CPU and GPU performance. Clearly, this is an area in which Intel has taken giant strides. Core i7-4770K marks a 180 per cent improvement over Sandy Bridge, and a 40 per cent improvement over Ivy Bridge. Intel's latest remains at the top of the chart, but to get a true feel for IGP performance, we need a more demanding 3D load.

| Intel Core i7-4770K Performance Gain/Loss |
Intel Core i7-3770K | Intel Core i7-2700K | AMD A10-5800K |
|---|---|---|---|
| + 86.3% | N/A | - 8.8% |
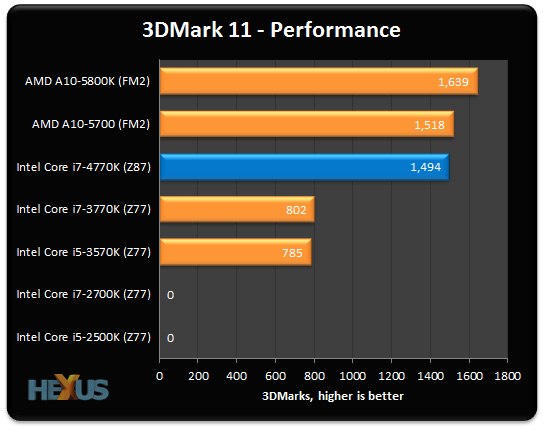
3DMark 11 does a much better job of stressing the IGP and helps paint a clearer picture. The HD 4600 built into the Core i7-4770K delivers almost twice the performance of the Core i7-3770K's HD 4000. A marked improvement, though still not enough to match the Radeon HD 7660D baked into AMD's latest APUs.
Remember, Sandy Bridge doesn't include a DX11-capable IGP, hence the lack of results.

| Intel Core i7-4770K Performance Gain/Loss |
Intel Core i7-3770K | Intel Core i7-2700K | AMD A10-5800K |
|---|---|---|---|
| + 39.9% | N/A | - 11.7% |
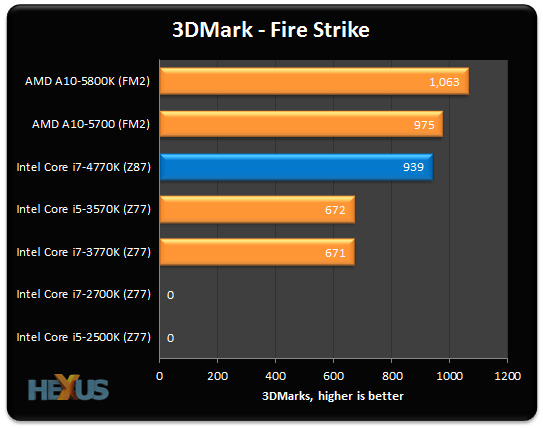
Intel has certainly closed the gap on AMD as far as IGP performance is concerned, but the HD 4600's enhanced capabilities leave us longing for more. If this middle-of-the-pack IGP can return over 900 3DMarks in the demanding Fire Strike test, what might a top-of-the-line Iris Pro 5200 with twice the number of execution units and a dedicated frame buffer achieve? It's a shame that self-built desktop users will never know.


