


Bang, Watt and Efficiency Per Buck - 2,560x1,440
Value analysis at 2,560x1,440 - QHD |
||||||||
|---|---|---|---|---|---|---|---|---|
| Graphics card | Aggregate FPS | Normalised FPS1 | Approx. price | Bang4buck | Power consumption | Bang4watt2 | HEXUS Efficiency Score3 | |
| NVIDIA GeForce GTX 1080 | 357.30 | 298.65 | 699 | 0.43 | 229 | 1.30 | 1.73 | |
| NVIDIA GeForce GTX 1070 | 289.10 | 256.85 | 449 | 0.57 | 197 | 1.30 | 1.87 | |
| NVIDIA GeForce GTX Titan X | 296.70 | 261.05 | 999 | 0.26 | 302 | 0.86 | 1.12 | |
| NVIDIA GeForce GTX 980 Ti | 285.60 | 253.30 | 649 | 0.39 | 296 | 0.86 | 1.25 | |
| NVIDIA GeForce GTX 980 | 225.40 | 213.80 | 430 | 0.50 | 225 | 0.95 | 1.45 | |
| NVIDIA GeForce GTX 970 | 178.76 | 148.14 | 329 | 0.45 | 195 | 0.76 | 1.21 | |
| NVIDIA GeForce GTX 780 Ti | 185.90 | 158.85 | 699 | 0.23 | 299 | 0.53 | 0.76 | |
| NVIDIA GeForce GTX 680 | 116.80 | 55.20 | 499 | 0.11 | 202 | 0.27 | 0.38 | |
| AMD Radeon Fury X | 232.90 | 216.15 | 649 | 0.33 | 344 | 0.63 | 0.96 | |
| AMD Radeon R9 390X | 212.10 | 191.85 | 380 | 0.50 | 349 | 0.55 | 1.05 | |
| AMD Radeon R9 390 | 198.40 | 175.50 | 330 | 0.53 | 333 | 0.53 | 1.06 | |
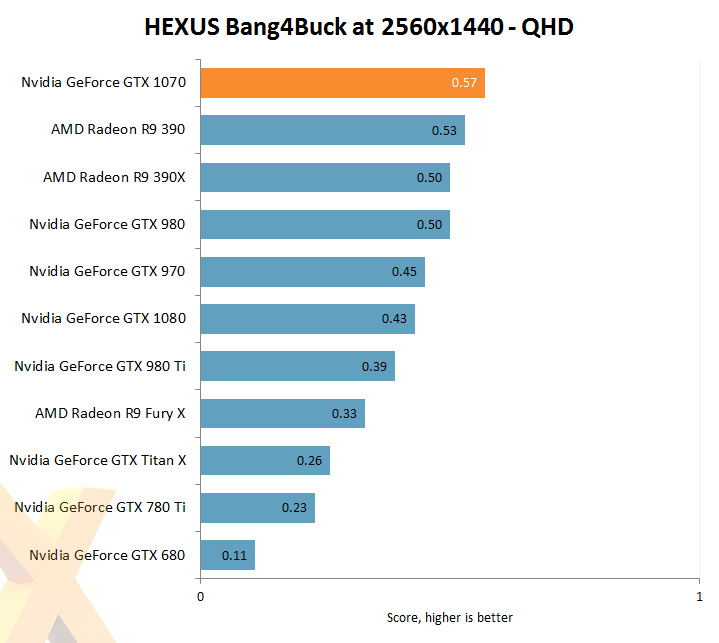
The same process is repeated at the 2,560x1,440 resolution. The majority of cards are able to hit close to 60fps with image quality settings to very high or ultra, and it's only the true champion GPUs that run much higher. The usual combination of normalised performance and price puts the GTX 1070 on top, though it's worth noting that the AMD R9 390 and 390X offer solid frame rates at decent prices.
These resolution and image settings are a step too far for the older GTX 680.
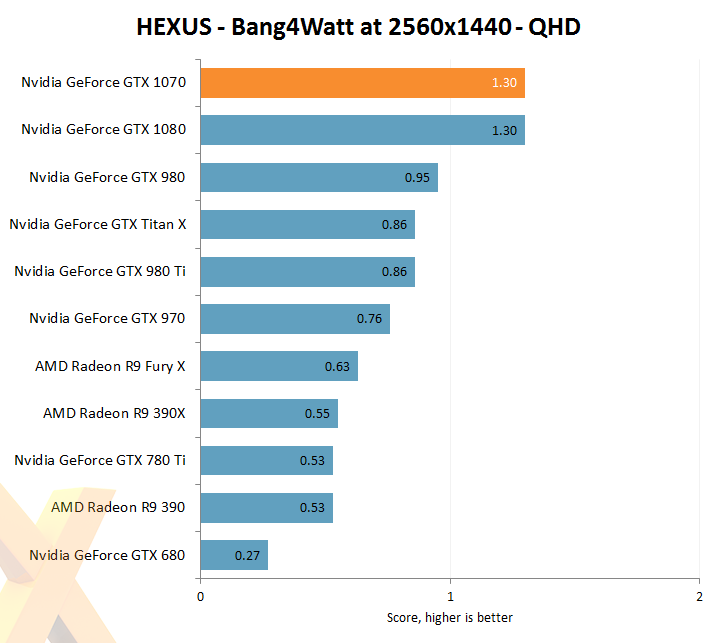
Here's where Pascal really shines. Excellent performance is accompanied by best-in-class energy efficiency. We'll only know how this metric truly plays out when AMD's next-gen GPU hardware arrives.
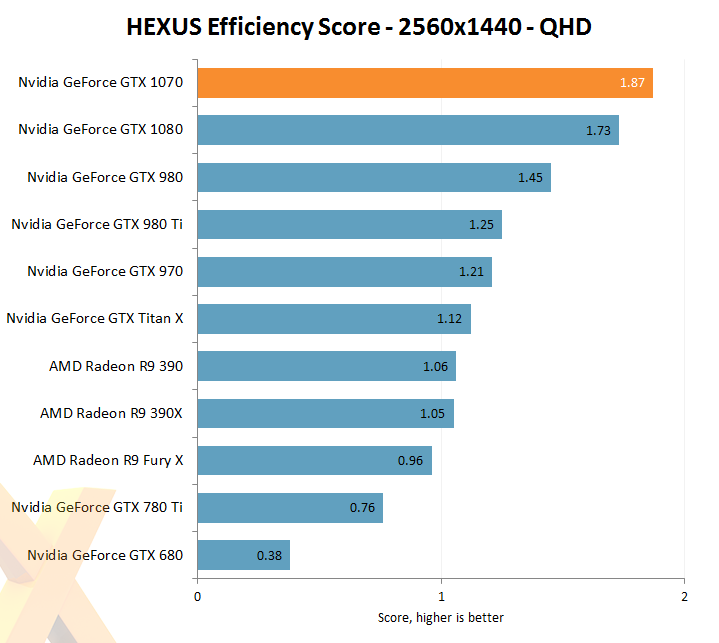
The combined score gives the GTX 1070 an impressive lead over any other GPU than its bigger brother.


