


Bang, Watt and Efficiency Per Buck - 1,920x1,080
Putting all the numbers into perspective, we're resurrecting an old favourite: the HEXUS bang4buck.
It enables us to take a closer look how overall performance - frame rates and energy efficiency - correlates with value for money.
In a rough-and-ready assessment of the cards' bang for buck, we've aggregated the frame-rates for all our gaming benchmarks, normalised them1 and taken account of pricing.
We opt for the MSRP, shown in dollars for easy reference, for GPUs that remain close to them. For the odd GPU that has been reduced significantly in price since its launch, we take the three lowest-priced cards at Newegg.com and average those prices. For the GPUs that are no longer available - GTX 680 and GTX 780 Ti, for example - we use their launch MSRP. This is unfortunate for those cards but we see no better way.
Consequently, the tables below highlight a metric that should only be used as a yardstick for evaluating comparative performance and energy efficiency with price factored in.
Value analysis at 1,920x1,080 - FHD |
||||||||
|---|---|---|---|---|---|---|---|---|
| Graphics card | Aggregate FPS | Normalised FPS1 | Approx. price (USD) | Bang4buck | Power consumption | Bang4watt2 | HEXUS Efficiency Score3 | |
| NVIDIA GeForce GTX 1080 | 524.30 | 382.10 | 699 | 0.55 | 229 | 1.67 | 2.22 | |
| NVIDIA GeForce GTX 1070 | 430.90 | 335.45 | 449 | 0.75 | 197 | 1.70 | 2.45 | |
| NVIDIA GeForce GTX Titan X | 438.00 | 339.00 | 999 | 0.34 | 302 | 1.12 | 1.46 | |
| NVIDIA GeForce GTX 980 Ti | 419.10 | 329.60 | 649 | 0.51 | 296 | 1.11 | 1.62 | |
| NVIDIA GeForce GTX 980 | 336.60 | 282.10 | 430 | 0.66 | 225 | 1.25 | 1.91 | |
| NVIDIA GeForce GTX 970 | 269.41 | 241.20 | 329 | 0.73 | 195 | 1.24 | 1.97 | |
| NVIDIA GeForce GTX 780 Ti | 274.40 | 240.10 | 699 | 0.34 | 299 | 0.80 | 1.24 | |
| NVIDIA GeForce GTX 680 | 171.73 | 137.60 | 499 | 0.28 | 202 | 0.68 | 0.96 | |
| AMD Radeon Fury X | 346.20 | 293.10 | 649 | 0.45 | 344 | 0.85 | 1.30 | |
| AMD Radeon R9 390X | 305.90 | 264.55 | 380 | 0.70 | 349 | 0.79 | 1.49 | |
| AMD Radeon R9 390 | 287.40 | 250.10 | 330 | 0.79 | 333 | 0.75 | 1.54 | |
1 the normalisation refers to taking playable frame rate into account. Should a card benchmark at over 60 frames per second in any one game, the extra fps count as half. This arguably diminishes the scoring potential of super-fast cards that can churn out 100fps-plus, but that's a nice luxury to have and, in a real-world sense, it would make sense to raise the resolution.
Similarly, should a card benchmark lower, say at 40fps, we deduct half the difference from its average frame rate and the desired 60fps, giving it a HEXUS.bang4buck score of 30fps. The minimum allowable frame rate, therefore, is 20fps but that scores zero.
2 the HEXUS.bang4watt score is a simple measurement of how much normalised performance the GPU provides when evaluated against system-wide power-draw that's shown in the table: the former is divided by the latter. We're using the peak system-wide power-draw numbers obtained by running Star Wars Battlefront
3 the HEXUS Efficiency Score is a combination of bang4buck and bang4watt, we simply add the two to rate combined value for money and power efficiency.
How They Compare
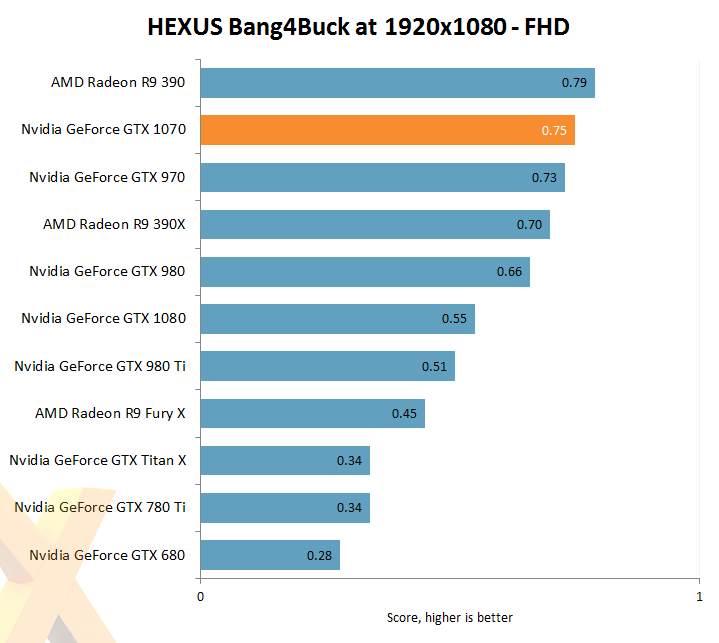
The leading graphics cards tend to have solid normalised performance and a keen street price. The Radeon R9 390 is certainly not the fastest GPU of this illustrious bunch but it does offer a smooth games-playing experience at a 1080p resolution and, crucially, an attractive street price. GeForce GTX 1070, meanwhile, offers more normalised performance yet costs significantly more. GTX 1080 is faster still though its surfeit of frame rate at 1080p is largely wasted. That $699 price tag counts against it, too.
Bottom line: GeForce GTX 1070 offers an enviable mix of high-speed action at 1080p and a retail price that can be supported by the fact that it's near the top of our chart.
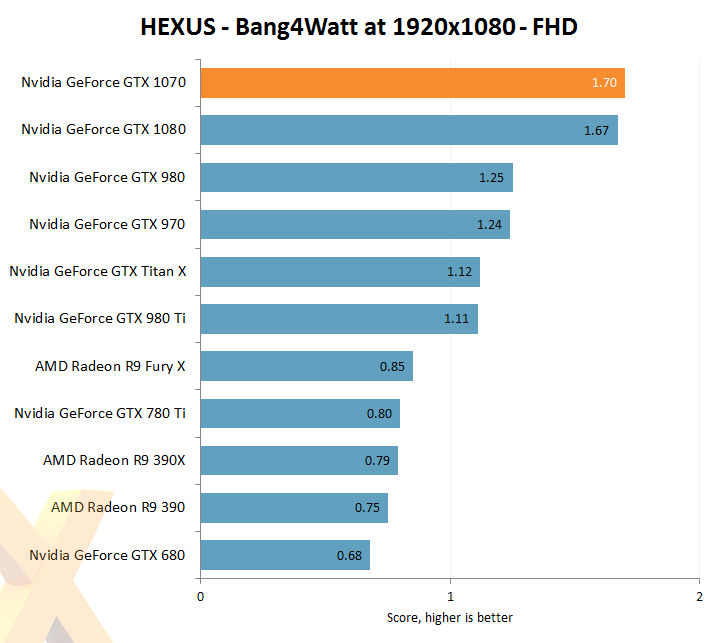
No one GPU causes distress to any quality mainstream PSU. That said, the new Pascal architecture, fabbed on a 16nm process, is excellent with regards to power consumption. The aggregate and normalised fps of the new card is akin to that of the GeForce GTX 980 Ti... at a significantly lower system-wide power consumption, and this is why the GTX 1070 looks strong here. GTX 1080 is faster, of course, but uses a shade more than linear power consumption, hence slotting in just behind.
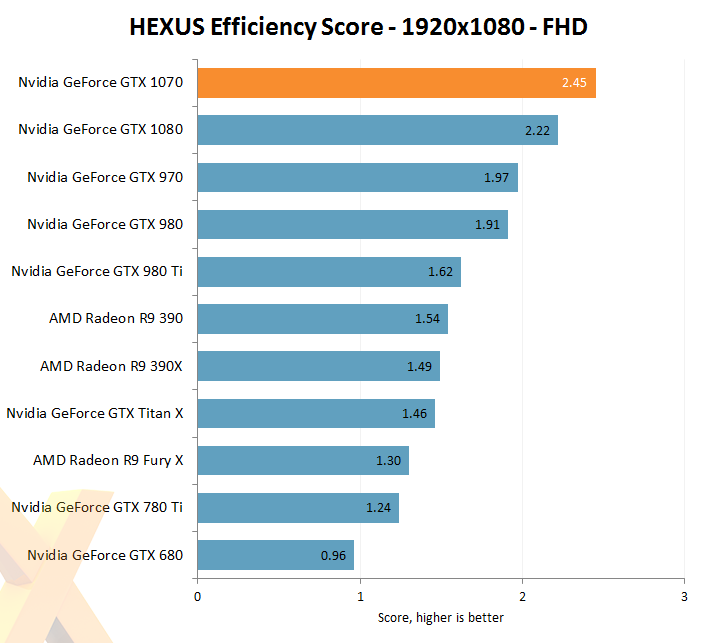
Combining the two metrics offers us an at-a-glance understanding of how normalised performance, price and efficiency all interact with one another. Our numbers indicate that at $449 the GeForce GTX 1070 is a good buy. The metric will only stretch out further when partners bring in basic cards equipped with a $379 price tag.


