


HEXUS.bang4buck and HEXUS.bang4watt
Putting all the numbers into perspective, let's take a closer look at overall performance and value for money.
In a rough-and-ready assessment of the cards' bang for buck, we've aggregated the 1,920x1,080 and 2,560x1,600 frame-rates for six games, normalised them1 and taken account of today's pricing.
But there are more provisos than we'd care to shake a stick at. We could have chosen six different games, the cards' prices could have been derived from other sources and pricing tends to fluctuate daily, especially for new-release GPUs.
Consequently, the table below highlight a metric that should only be used as a yardstick for evaluating comparative performance with price factored in. Other architectural benefits are not covered, obviously.
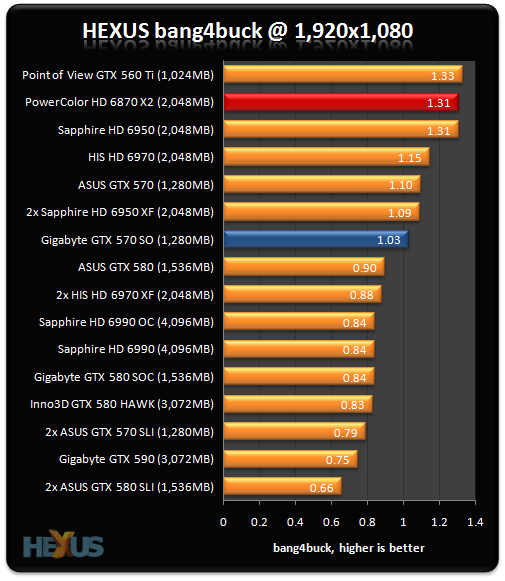
Value analysis at 1,920x1,080 |
|||||||
|---|---|---|---|---|---|---|---|
| Graphics card | Aggregate FPS | Normalised FPS | Current price | Bang4buck1 | Power consumption2 | Bang4watt3 | |
| Gigabyte GeForce GTX 590 (3,072MB) | 538.4 | 433.5 | £575 | 0.75 | 393 | 1.10 | |
| 2x ASUS GeForce GTX 580 in SLI (3,072MB) | 620.4 | 486.9 | £740 | 0.66 | 524 | 0.93 | |
| 2x ASUS GeForce GTX 570 in SLI (2,560MB) | 553.5 | 443.4 | £530 | 0.79 | 419 | 1.06 | |
| Gigabyte GeForce GTX 580 SOC (1,536MB) | 414.6 | 349.4 | £420 | 0.84 | 328 | 1.07 | |
| Inno3D GeForce GTX 580 HAWK (3,072MB) | 392.4 | 333.9 | £400 | 0.83 | 236 | 1.41 | |
| ASUS GeForce GTX 580 (1,536MB) | 387.7 | 331.5 | £370 | 0.90 | 256 | 1.30 | |
| Gigabyte GeForce GTX 570 SO (1,280MB) | 364.5 | 307.8 | £300 | 1.03 | 209 | 1.47 | |
| ASUS GeForce GTX 570 (1,280MB) | 345.1 | 292.8 | £265 | 1.1 | 186 | 1.57 | |
| Point of View GeForce GTX 560 Ti (1,024MB) | 297.1 | 239.4 | £180 | 1.33 | 165 | 1.45 | |
| Sapphire Radeon HD 6990 OC (4,096MB) | 554.8 | 447.5 | £530 | 0.84 | 399 | 1.12 | |
| Sapphire Radeon HD 6990 (4,096MB) | 545.6 | 443.9 | £530 | 0.84 | 349 | 1.27 | |
| 2x HIS Radeon HD 6970 in CrossFire (4,096MB) | 568.4 | 458.0 | £520 | 0.88 | 465 | 0.98 | |
| 2x Sapphire Radeon HD 6950 in CrossFire (4,096MB) | 536.9 | 437.2 | £400 | 1.09 | 303 | 1.44 | |
| PowerColor HD 6870 X2 | 502.1 | 411.4 | £315 | 1.31 | 317 | 1.30 | |
| HIS Radeon HD 6970 (2,048MB) | 352.8 | 300.1 | £260 | 1.15 | 193 | 1.55 | |
| Sapphire Radeon HD 6950 (2,048MB) | 320 | 262.6 | £200 | 1.31 | 130 | 2.02 | |
1 the normalisation refers to taking playable frame rate into account. Should a card benchmark at over 60 frames per second in any one game, the extra fps count as half. Similarly, should a card benchmark lower, say at 40fps, we deduct half the difference from its average frame rate and the desired 60fps, giving it a HEXUS.bang4buck score of 30 marks. The minimum allowable frame rate is 20fps but that scores zero.
2 the GPU power consumption is derived from subtracting a flat rate of 100W - indicating system power-draw without a card - from the Call of Duty: Black Ops load figure. While this figure isn't solely indicative of power pulled by the GPU, as the CPU also throttles up, it's a better metric than using peak system-draw alone.
3 the HEXUS.bang4watt score is a crude measurement of how much normalised performance the GPU provides when evaluated against GPU power-draw that's shown in the table: the former is divided by the latter. We're using the peak power-draw numbers obtained by running real-world Just Cause 2.
Analysis
While a GTX 570 is available for £240 if you look hard enough, we've gone with a specific model represented by the £265 ASUS. Factor in the performance and our numbers show that spending the extra on the Gigabyte doesn't return a linear increase for in-game perf - and this is why the GTX 570 SO's HEXUS.bang4buck is lower.
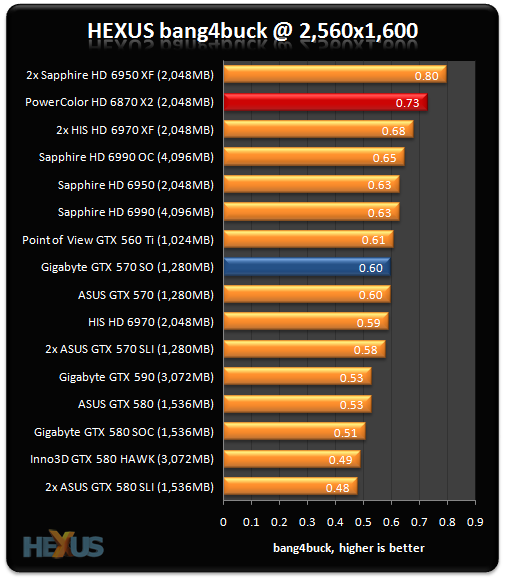
Value analysis at 2,560x1,600 |
|||||||
|---|---|---|---|---|---|---|---|
| Graphics card | Aggregate FPS | Normalised FPS | Current price | Bang4buck1 | Power consumption2 | Bang4watt3 | |
| Gigabyte GeForce GTX 590 (3,072MB) | 361.7 | 306.9 | £575 | 0.53 | 393 | 0.78 | |
| 2x ASUS GeForce GTX 580 in SLI (3,072MB) | 423.4 | 356.5 | £740 | 0.48 | 524 | 0.68 | |
| 2x ASUS GeForce GTX 570 in SLI (2,560MB) | 365.7 | 309.1 | £530 | 0.58 | 419 | 0.74 | |
| Gigabyte GeForce GTX 580 SOC (1,536MB) | 272.1 | 215.1 | £420 | 0.51 | 328 | 0.66 | |
| Inno3D GeForce GTX 580 HAWK (3,072MB) | 256.3 | 196.4 | £400 | 0.49 | 236 | 0.83 | |
| ASUS GeForce GTX 580 (1,536MB) | 256.9 | 196.8 | £370 | 0.53 | 256 | 0.55 | |
| Gigabyte GeForce GTX 570 SO (1,280MB) | 237.7 | 180.1 | £300 | 0.6 | 209 | 0.86 | |
| ASUS GeForce GTX 570 (1,280MB) | 221.8 | 159.5 | £265 | 0.6 | 186 | 0.86 | |
| Point of View GeForce GTX 560 Ti (1,024MB) | 175.1 | 109.5 | £180 | 0.61 | 165 | 0.66 | |
| Sapphire Radeon HD 6990 OC (4,096MB) | 404.3 | 335.9 | £530 | 0.65 | 399 | 0.84 | |
| Sapphire Radeon HD 6990 (4,096MB) | 393.2 | 326.6 | £530 | 0.63 | 349 | 0.94 | |
| 2x HIS Radeon HD 6970 in CrossFire (4,096MB) | 427.7 | 354.4 | £520 | 0.68 | 465 | 0.76 | |
| 2x Sapphire Radeon HD 6950 in CrossFire (4,096MB) | 390.8 | 319.9 | £400 | 0.80 | 303 | 1.06 | |
| PowerColor HD 6870 X2 (2,048MB) | 299 | 229.5 | £315 | 0.73 | 317 | 0.72 | |
| HIS Radeon HD 6970 (2,048MB) | 232 | 152.6 | £260 | 0.59 | 193 | 0.79 | |
| Sapphire Radeon HD 6950 (2,048MB) | 207.6 | 126.7 | £200 | 0.63 | 130 | 0.98 | |
But put the resolution up to 2,560x1,600 and the identical HEXUS.bang4buck means that extra spend and performance and tied together.
Summary
This particular metric doesn't take into account cooling performance, noise or overclockability, mind, so the Gigabyte's mid-pack numbers are actually pretty good once you add those in.


