


Consistency
Most benchmarks hammer the SSD when it's in a fresh or near-fresh state. What we really want to know is how the SSDs respond when they've been degraded, as happens over time, before technologies such as TRIM ameliorate the damage.
What's needed, ideally, are tests that keep the drives occupied for a while, hamstringing their performance, and then benchmark them in this heavily-used state.
Here's where PCMark 8's expanded storage tests come in. The consistency test measures the performance consistency and degradation tendency of a storage system. In the first part of the test, the cycle continues until a steady degraded level of performance has been reached.
Starting by writing 128KB writes across the whole drive and then degrading it further by random writes varying in size between 4KB and 1MB, the 10 trace benchmarks are run in between the degradation phases. Once in steady phase, achieved by 45 minutes of random writes, the tests are then run again between each phase.
In the second part, the recovery of the system is tested by allowing the system to idle and measuring the performance with long intervals. The final recovery phase allows the drive five minutes of idle time, ostensibly for TRIM commands, and then benchmarks them against the 10 different activities.
So, you have performance when the drive is degraded, when it's in a steady state, and when it has a chance of recovery. In all, there are 18 phases to the test - eight degradation, five steady and five recovery - and the best drives should be able to keep up a high level of performance in each area. The benchmark returns a multitude of data, from latency, bandwidth, access time, playback time to busy time.
We've chosen to focus on the Photoshop Heavy and Battlefield 3 trace tests, out of a possible 10, thus mirroring heavy 2D and 3D loads on the storage system.
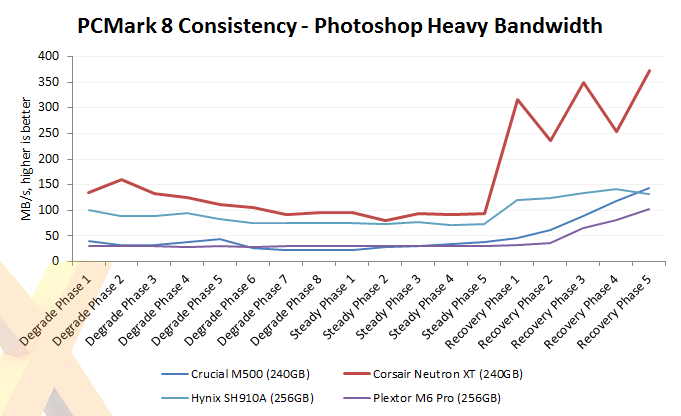
The ideal result is a smooth line that suddenly arches upwards as the recovery phase sets in. Neutron XT produces the best overall performance here, but what's notable is just how fast it becomes when allowed to recover. Sure, it's not the smoothest transition, but it regularly hits 300MB/s during these last five phases.

The gaming Battlefield 3 test is far more predictable in nature. Excellent performance is characterised by a flat line high up on the graph, and this is what the Neutron XT produces. The drive is pushing over 200MB/s in any state, degraded or otherwise, so you're likely to have good gaming performance (as far as data-loading is concerned) at all times.


