


HEXUS bang4buck and bang4watt
Putting all the numbers into perspective, let's take a closer look at overall performance, efficiency and value for money.
In a rough-and-ready assessment of the cards' bang for buck, we've aggregated the frame-rates for all our gaming benchmarks, normalised them1 and taken account of today's pricing.
But there are more provisos than we'd care to shake a stick at. We could have chosen different games, the cards' prices could have been derived from other sources, and pricing tends to fluctuate daily.
Consequently, the tables below highlight a metric that should only be used as a yardstick for evaluating comparative performance with price and efficiency factored in.
Value analysis at 1,920x1,080 |
|||||||||
|---|---|---|---|---|---|---|---|---|---|
| Graphics card | Aggregate FPS | Normalised FPS1 | Approx. price | Bang4buck | Power consumption | Bang4watt2 | HEXUS Efficiency Score3 | ||
| AMD HD 7970 (3,072MB) | 360.20 | 325.20 | £420 | 0.77 | 254 | 1.28 | 2.05 | ||
| AMD HD 7950 (3,072MB) | 311.20 | 267.50 | £340 | 0.79 | 207 | 1.29 | 2.08 | ||
| Gigabyte HD 7870 OC (2,048MB) | 283.10 | 232.05 | £290 | 0.80 | 214 | 1.08 | 1.88 | ||
| PowerColor HD 7870 PCS+ (2,048MB) | 285.80 | 234.90 | £285 | 0.82 | 221 | 1.06 | 1.88 | ||
| AMD HD 7870 (2,048MB) | 272.80 | 219.80 | £270 | 0.81 | 182 | 1.21 | 2.02 | ||
| AMD HD 7850 (2,048MB) | 235.50 | 173.05 | £190 | 0.91 | 162 | 1.07 | 1.98 | ||
| AMD HD 7770 (1,024MB) | 155.10 | 52.65 | £110 | 0.48 | 137 | 0.38 | 0.86 | ||
| NVIDIA GTX 580 (1,536MB) | 304.90 | 257.55 | £300 | 0.86 | 285 | 0.90 | 1.76 | ||
| NVIDIA GTX 570 (1,280MB) | 261.40 | 204.10 | £210 | 0.97 | 245 | 0.70 | 1.67 | ||
| NVIDIA GTX 560 Ti 448 (1,280MB) | 248.80 | 187.90 | £195 | 0.96 | 271 | 0.69 | 1.65 | ||
| NVIDIA GTX 560 Ti (1,024MB) | 215.40 | 143.10 | £155 | 0.92 | 225 | 0.64 | 1.56 | ||
Value analysis at 2,560x1,600 |
|||||||||
|---|---|---|---|---|---|---|---|---|---|
| Graphics card | Aggregate FPS | Normalised FPS1 | Approx. price | Bang4buck | Power consumption | Bang4watt2 | HEXUS Efficiency Score3 | ||
| AMD HD 7970 (3,072MB) | 218.50 | 147.75 | £420 | 0.35 | 254 | 0.58 | 0.93 | ||
| AMD HD 7950 (3,072MB) | 187.30 | 100.95 | £340 | 0.30 | 207 | 0.49 | 0.79 | ||
| Gigabyte HD 7870 OC (2,048MB) | 165.60 | 68.40 | £290 | 0.24 | 214 | 0.32 | 0.56 | ||
| PowerColor HD 7870 PCS+ (2,048MB) | 167.00 | 70.50 | £285 | 0.25 | 221 | 0.32 | 0.57 | ||
| AMD HD 7870 (2,048MB) | 160.20 | 60.30 | £270 | 0.22 | 182 | 0.33 | 0.55 | ||
| AMD HD 7850 (2,048MB) | 138.00 | 31.65 | £190 | 0.17 | 162 | 0.20 | 0.37 | ||
| AMD HD 7770 (1,024MB) | 72.20 | 1.80 | £110 | 0.02 | 137 | 0.01 | 0.03 | ||
| NVIDIA GTX 580 (1,536MB) | 175.30 | 82.95 | £300 | 0.28 | 285 | 0.29 | 0.57 | ||
| NVIDIA GTX 570 (1,280MB) | 139.50 | 39.15 | £210 | 0.19 | 245 | 0.15 | 0.34 | ||
| NVIDIA GTX 560 Ti 448 (1,280MB) | 133.60 | 32.55 | £195 | 0.17 | 271 | 0.12 | 0.29 | ||
| NVIDIA GTX 560 Ti (1,024MB) | 96.40 | 18.00 | £155 | 0.12 | 225 | 0.08 | 0.20 | ||
1 the normalisation refers to taking playable frame rate into account. Should a card benchmark at over 60 frames per second in any one game, the extra fps count as half. Similarly, should a card benchmark lower, say at 40fps, we deduct half the difference from its average frame rate and the desired 60fps, giving it a bang4buck score of 30 marks. The minimum allowable frame rate is 20fps but that scores zero.
2 the bang4watt score is a crude measurement of how much normalised performance the GPU provides when evaluated against system-wide power-draw that's shown in the table: the former is divided by the latter. We're using the peak power-draw numbers obtained by running real-world Crysis 2.
3 the HEXUS Efficiency Score is a combination of bang4buck and bang4watt, we simply add the two to rate combined value for money and power efficiency.
Summary
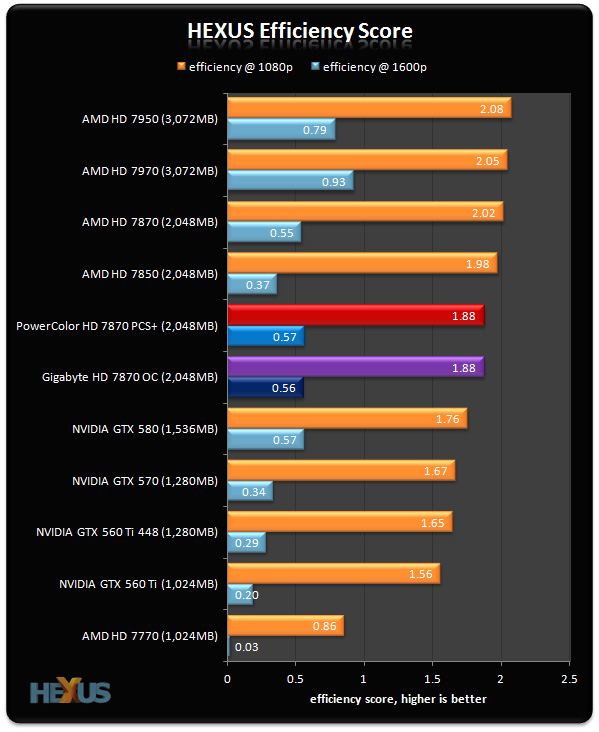
Here's an interesting twist. We've taken our popular bang4buck and bang4watt metrics, and combined them to create an overall Efficiency Score that takes into account FPS performance, price and power consumption.
The graph paints a unique picture. For example, the GeForce GTX 570 offers the best bang4buck at 1080p - performance is particularly strong at the recently-revised £210 price point - but the ageing card is power hungry and falls into the bottom half of the chart as a result.
And the factory-overclocked Radeons are intriguingly positioned, too. Both cards score well in the bang4buck metric, but the added cost and the increased power consumption leaves them behind AMD's reference card when tested at a full-HD resolution.


