


HEXUS.bang4buck and bang4watt
Putting all the numbers into perspective, let's take a closer look at overall performance and value for money.
In a rough-and-ready assessment of the cards' bang for buck, we've aggregated the frame-rates for all our gaming benchmarks, normalised them1 and taken account of today's pricing.
But there are more provisos than we'd care to shake a stick at. We could have chosen different games, the cards' prices could have been derived from other sources, and pricing tends to fluctuate daily, especially for new-release GPUs.
Consequently, the tables below highlight a metric that should only be used as a yardstick for evaluating comparative performance with price factored in.
Value analysis at 1,920x1,080 |
||||||||
|---|---|---|---|---|---|---|---|---|
| Graphics card | Aggregate FPS | Normalised FPS1 | Approx. price | Bang4buck | Power consumption | Bang4watt2 | ||
| AMD Radeon HD 7970 (3,072MB) | 360.20 | 325.20 | £450 | 0.72 | 254 | 1.28 | ||
| XFX Radeon HD 7950 BE DD (3,072MB) | 342.60 | 307.10 | £390 | 0.79 | 217 | 1.42 | ||
| Sapphire Radeon HD 7950 OC (3,072MB) | 335.30 | 298.15 | £380 | 0.78 | 216 | 1.38 | ||
| PowerColor Radeon HD 7950 PCS+ (3,072MB) | 332.20 | 293.70 | £370 | 0.79 | 218 | 1.35 | ||
| AMD Radeon HD 7950 (3,072MB) | 311.20 | 267.50 | £350 | 0.76 | 207 | 1.29 | ||
| AMD Radeon HD 6990 (4,096MB) | 446.10 | 387.95 | £530 | 0.73 | 362 | 1.07 | ||
| AMD Radeon HD 6970 (2,048MB) | 254.70 | 200.75 | £255 | 0.79 | 237 | 0.85 | ||
| AMD Radeon HD 6950 (2,048MB) | 226.80 | 160.20 | £185 | 0.87 | 194 | 0.83 | ||
| AMD Radeon HD 6870 (1,024MB) | 203.90 | 125.85 | £140 | 0.90 | 187 | 0.67 | ||
| NVIDIA GeForce GTX 590 (3,072MB) | 446.10 | 403.05 | £620 | 0.65 | 407 | 0.99 | ||
| NVIDIA GeForce GTX 580 (1,536MB) | 304.90 | 257.55 | £349 | 0.74 | 285 | 0.90 | ||
| NVIDIA GeForce GTX 570 (1,280MB) | 261.40 | 204.10 | £240 | 0.85 | 245 | 0.70 | ||
| NVIDIA GeForce GTX 560 Ti 448 (1,280MB) | 248.80 | 187.90 | £220 | 0.85 | 271 | 0.69 | ||
| NVIDIA GeForce GTX 560 Ti (1,024MB) | 215.40 | 143.10 | £170 | 0.84 | 225 | 0.64 | ||
Value analysis at 2,560x1,600 |
||||||||
|---|---|---|---|---|---|---|---|---|
| Graphics card | Aggregate FPS | Normalised FPS1 | Approx. price | Bang4buck | Power consumption | Bang4watt2 | ||
| AMD Radeon HD 7970 (3,072MB) | 218.50 | 147.75 | £450 | 0.33 | 254 | 0.58 | ||
| XFX Radeon HD 7950 BE DD (3,072MB) | 207.50 | 131.25 | £390 | 0.34 | 217 | 0.60 | ||
| Sapphire Radeon HD 7950 OC (3,072MB) | 201.00 | 121.50 | £380 | 0.32 | 216 | 0.56 | ||
| PowerColor Radeon HD 7950 PCS+ (3,072MB) | 198.00 | 117.00 | £370 | 0.32 | 218 | 0.54 | ||
| AMD Radeon HD 7950 (3,072MB) | 187.30 | 100.95 | £350 | 0.29 | 207 | 0.49 | ||
| AMD Radeon HD 6990 (4,096MB) | 270.30 | 213.35 | £530 | 0.40 | 362 | 0.59 | ||
| AMD Radeon HD 6970 (2,048MB) | 150.50 | 50.25 | £255 | 0.20 | 237 | 0.21 | ||
| AMD Radeon HD 6950 (2,048MB) | 133.70 | 32.40 | £185 | 0.18 | 194 | 0.17 | ||
| AMD Radeon HD 6870 (1,024MB) | 83.00 | 15.75 | £140 | 0.11 | 187 | 0.08 | ||
| NVIDIA GeForce GTX 590 (3,072MB) | 266.90 | 211.65 | £620 | 0.34 | 407 | 0.52 | ||
| NVIDIA GeForce GTX 580 (1,536MB) | 175.30 | 82.95 | £349 | 0.24 | 285 | 0.29 | ||
| NVIDIA GeForce GTX 570 (1,280MB) | 139.50 | 39.15 | £240 | 0.16 | 245 | 0.15 | ||
| NVIDIA GeForce GTX 560 Ti 448 (1,280MB) | 133.60 | 32.55 | £220 | 0.15 | 271 | 0.12 | ||
| NVIDIA GeForce GTX 560 Ti (1,024MB) | 96.40 | 18.00 | £170 | 0.11 | 225 | 0.08 | ||
1 the normalisation refers to taking playable frame rate into account. Should a card benchmark at over 60 frames per second in any one game, the extra fps count as half. Similarly, should a card benchmark lower, say at 40fps, we deduct half the difference from its average frame rate and the desired 60fps, giving it a HEXUS.bang4buck score of 30 marks. The minimum allowable frame rate is 20fps but that scores zero.
2 the HEXUS.bang4watt score is a crude measurement of how much normalised performance the GPU provides when evaluated against system-wide power-draw that's shown in the table: the former is divided by the latter. We're using the peak power-draw numbers obtained by running real-world Crysis 2.
Summary
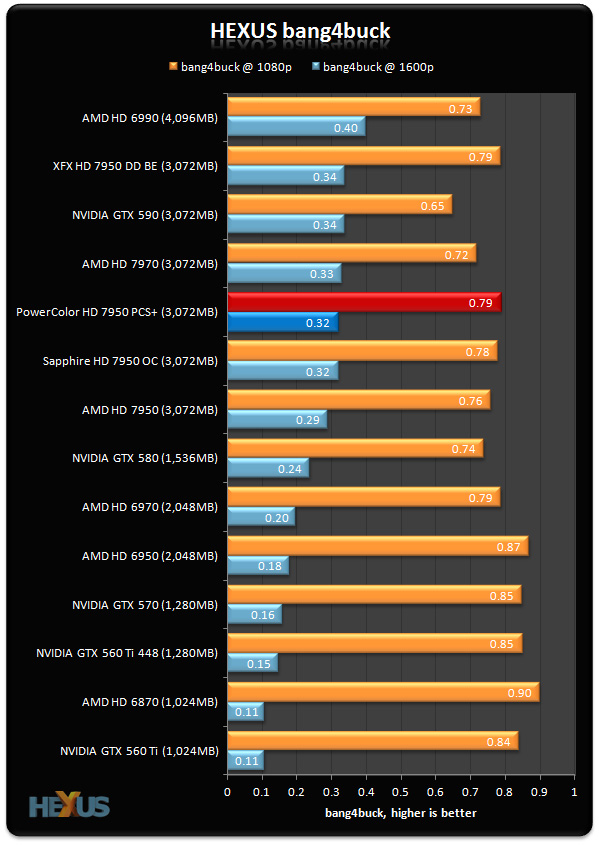
It's important to remember that our bang4buck is based on a few titles and doesn't take other architectural advantages into account; power-draw, operating temperature and noise output isn't considered. For the purpose of this metric, we're evaluating how much gaming performance per pound each configuration offers.
There's £20 separating the three custom Radeon HD 7950s, but the bang4buck results are still practically identical. That's because the respective overclock of each card is enough to balance out the saving. What's clear, though, is that all three pre-overclocked cards offer a greater amount of performance for your pound than AMD's reference design.


