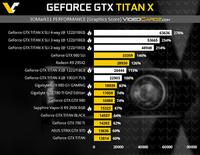
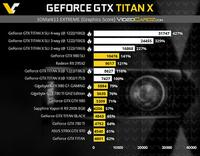
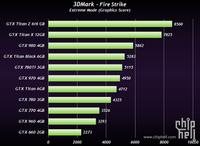
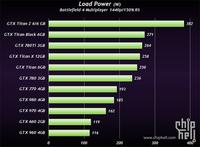
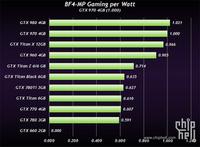
More than one source has already published benchmark scores said to show Nvidia GeForce GTX Titan X performance. VideoCardz has published a set of 3DMark scores and comparisons charting Titan X performance at various core and memory clocks and in single card, 2 way, 3 way and even 4 way SLI configurations. Another source, a forum member on China's ChipHell, has published a 3DMark Fire Strike chart and charts showing power consumption while playing Battlefield 4 Multiplayer.
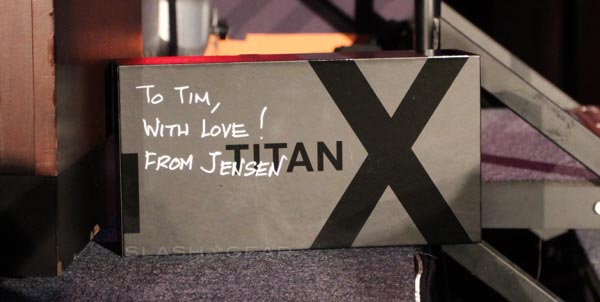
We saw our first official glimpses of the Titan X a week ago when a brand spanking new boxed sample was presented by Nvidia CEO Jen-Hsun Huang to Epic Games CEO Tim Sweeney during Epic's GDC keynote. However despite its appearance on stage we only got to learn that it boasts 8 billion transistors and a 12GB buffer. Nvidia understandably wants to have something left to reveal at the GPU Technology Conference which kicks off on 17th March.
VideoCardz has published a variety of benchmark comparisons claiming to show Nvidia GeForce GTX Titan X performance. As well as the charts, it says that the Titan X has the following key specifications; 1002MHz base clock (boost clock unknown), 1753 MHz (7 GHz effective) memory clock. With its 384-bit memory interface this gives a maximum theoretical bandwidth of 336 GB/s. The other, yet "to be confirmed," key specifications are; 3072 CUDA cores, 192 TMUs, 96 ROPs, a 250W TDP and a price of $999. The benchmarks were undertaken on a system sporting an Intel Core i7-5960X eight-core processor.
 |
 |
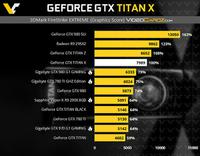 |
Click above to zoom in on the alleged benchmark charts from VideoCardz. The site has even more benchmarks and charts available if you are interested.
Not wanting to be left behind in pre-launch revelations ChipHell forum member Junmiu has published a set of comparative performance benchmarks and power consumption scores for another alleged Nvidia GeForce GTX Titan X card. The 3DMark Extreme Fire Strike result of 7825 is pretty close to VideoCardz's 7989 score. However we have even less background system information from this benchmark run.
 |
 |
 |
Click above to zoom in on the alleged benchmark charts from ChipHell. Further charts and information (in Chinese) is available in that forum.


