Test Methodology

GPU comparisons |
|||||||
|---|---|---|---|---|---|---|---|
| Graphics card | Approx. pricing |
GPU clock (MHz) |
Stream processors |
Shader clock (MHz) |
Memory clock (MHz) |
Memory bus (bits) |
Graphics driver |
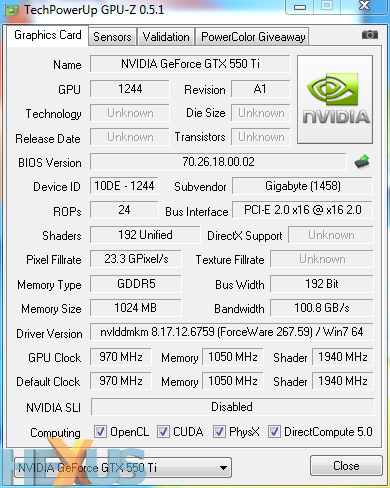
| Gigabyte GeForce GTX 550 Ti OC 1,024MB | £130 | 970 | 192 | 1,940 | 4,200 | 192 | ForceWare 267.59 |
| NVIDIA GeForce GTX 550 Ti 1,024MB | £120 | 900 | 192 | 1,800 | 4,100 | 192 | ForceWare 267.59 |
| EVGA GeForce GTX 460 1,024MB | £140 | 675 | 336 | 1,350 | 3,600 | 256 | ForceWare 267.59 |
| KFA2 GeForce GTX 460 768MB | £125 | 675 | 336 | 1,350 | 3,600 | 192 | ForceWare 267.59 |
| Inno3D GeForce GTS 450 1,024MB | £90 | 783 | 192 | 1,566 | 3,608 | 128 | ForceWare 267.59 |
| Sapphire Radeon HD 6850 1,024MB | £140 | 775 | 960 | 775 | 4,000 | 256 | Catalyst 11.4 |
| HIS Radeon HD 5770 1,024MB | £100 | 850 | 800 | 850 | 4,800 | 128 | Catalyst 11.4 |
| Sapphire Radeon HD 5750 1,024MB | £90 | 700 | 720 | 700 | 4,600 | 128 | Catalyst 11.4 |
Test bench |
||||||||||||
|---|---|---|---|---|---|---|---|---|---|---|---|---|
| CPU | Intel Core i5 2500K (3.3GHz, 6MB L3 cache, quad-core, LGA1155) | |||||||||||
| Motherboard | Intel DP67BG | |||||||||||
| Memory | 8GB Corsair Vengeance (9-9-9-24-2T @ 1,600MHz) | |||||||||||
| Power Supply | Corsair AX750 | |||||||||||
| Monitor | Dell 30in 3007WFP | |||||||||||
| Disk drive(s) | Crucial RealSSD C300 (256GB) | |||||||||||
| Chassis | Corsair Graphite Series 600T | |||||||||||
| Operating system | Windows 7 SP1, 64-bit | |||||||||||
Benchmarks |
||||||||||||
|---|---|---|---|---|---|---|---|---|---|---|---|---|
| 3DMark 11 | Performance preset, overall score and combined test results recorded. | |||||||||||
| Aliens vs. Predator | DX11, 1,280x720 and 1,920x1,080 resolutions, 2xAA, 8xAF, medium quality. | |||||||||||
| Call of Duty: Black Ops | DX9, 1,280x720 and 1,920x1,080 resolutions, 4xAA, ultra quality, FRAPS-recorded benchmark. | |||||||||||
| F1 2010 | DX11, 1,280x720 and 1,920x1,080 resolutions, 4xAA, high quality, Monaco circuit. | |||||||||||
| Just Cause 2 | DX10, 1,280x720 and 1,920x1,080 resolutions, 4xAA, 16xAF, medium/high quality, Dark Tower benchmark. | |||||||||||
| Metro 2033 | DX11, 1,280x720 and 1,920x1,080 resolutions, 4xAA, 16xAF, medium quality. | |||||||||||
| StarCraft II | DX9, 1,280x720 and 1,920x1,080 resolutions, 2xAA, high quality. | |||||||||||
| Power consumption | To emulate real-world usage scenarios, we record mains power draw both when idle and whilst playing Aliens vs. Predator. And, for a worst-case scenario, we throw in numbers from the FurMark stress test. | |||||||||||
| Temperature | To emulate real-world usage scenarios, we record GPU core temperature both when idle and whilst playing Aliens vs. Predator. And, for a worst-case scenario, we throw in numbers from the FurMark stress test. | |||||||||||
| Noise | A PCE-318 noise level meter is placed at front of a Corsair 600T chassis with side panel on. | |||||||||||
Notes
For our mid-range testing, we've made the transition to a new Intel Sandy Bridge platform consisting primarily of an Intel P67 motherboard and a Core i5 2500K CPU.
Coinciding with the move to our new test rig, we've also made the jump to Windows 7 SP1 and refreshed our benchmark suite. The new additions to our line up include the synthetic 3DMark 11 benchmark, F1 2010, Metro 2033 and StarCraft 2. All games are tested at the 720p and 1080p resolutions that everyone's familiar with, and the benchmark most are waiting for - Crysis 2 - will be added upon release.
For this particular review, it's worth noting that we've benchmarked the Gigabyte GeForce GTX 550 Ti OC twice - once as shipped, and again with downclocked speeds (900MHz/4,100MHz) to represent a vanilla GTX 550 Ti. We figured you'd want to know how NVIDIA's default configuration compares to the competition.
A new card, a new test bench and a revamped suite of benchmarks. Let's see how the eight sub-£150 cards compare.


