


HEXUS.bang4buck and bang4watt
Putting all the numbers into perspective, let's take a closer look at overall performance and value for money.
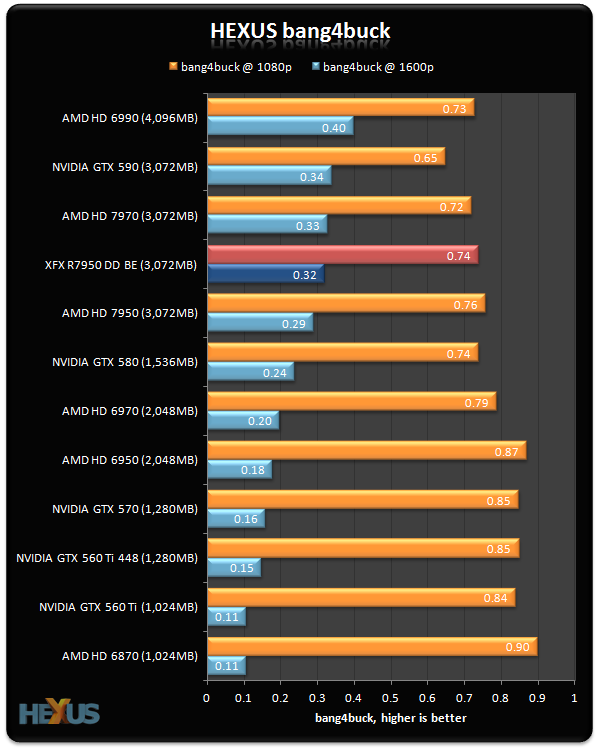
In a rough-and-ready assessment of the cards' bang for buck, we've aggregated the frame-rates for all our gaming benchmarks, normalised them1 and taken account of today's pricing.
But there are more provisos than we'd care to shake a stick at. We could have chosen different games, the cards' prices could have been derived from other sources, and pricing tends to fluctuate daily, especially for new-release GPUs such as the Radeon HD 7950.
Consequently, the tables below highlight a metric that should only be used as a yardstick for evaluating comparative performance with price factored in.
Value analysis at 1,920x1,080 |
||||||||
|---|---|---|---|---|---|---|---|---|
| Graphics card | Aggregate FPS | Normalised FPS1 | Current price | Bang4buck | Power consumption | Bang4watt2 | ||
| AMD Radeon HD 6990 (4,096MB) | 446.10 | 387.95 | £530 | 0.73 | 362 | 1.07 | ||
| AMD Radeon HD 7970 (3,072MB) | 360.20 | 325.20 | £450 | 0.72 | 254 | 1.28 | ||
| XFX Radeon HD 7950 BE DD (3,072MB) | 342.60 | 307.10 | £415 | 0.74 | 217 | 1.42 | ||
| AMD Radeon HD 7950 (3,072MB) | 311.20 | 267.50 | £350 | 0.76 | 207 | 1.29 | ||
| AMD Radeon HD 6970 (2,048MB) | 254.70 | 200.75 | £255 | 0.79 | 237 | 0.85 | ||
| AMD Radeon HD 6950 (2,048MB) | 226.80 | 160.20 | £185 | 0.87 | 194 | 0.83 | ||
| AMD Radeon HD 6870 (1,024MB) | 203.90 | 125.85 | £140 | 0.90 | 187 | 0.67 | ||
| NVIDIA GeForce GTX 590 (3,072MB) | 446.10 | 403.05 | £620 | 0.65 | 407 | 0.99 | ||
| NVIDIA GeForce GTX 580 (1,536MB) | 304.90 | 257.55 | £349 | 0.74 | 285 | 0.90 | ||
| NVIDIA GeForce GTX 570 (1,280MB) | 261.40 | 204.10 | £240 | 0.85 | 245 | 0.70 | ||
| NVIDIA GeForce GTX 560 Ti 448 (1,280MB) | 248.80 | 187.90 | £220 | 0.85 | 271 | 0.69 | ||
| NVIDIA GeForce GTX 560 Ti (1,024MB) | 215.40 | 143.10 | £170 | 0.84 | 225 | 0.64 | ||
Value analysis at 2,560x1,600 |
||||||||
|---|---|---|---|---|---|---|---|---|
| Graphics card | Aggregate FPS | Normalised FPS1 | Current price | Bang4buck | Power consumption | Bang4watt2 | ||
| AMD Radeon HD 6990 (4,096MB) | 270.30 | 213.35 | £530 | 0.40 | 362 | 0.59 | ||
| AMD Radeon HD 7970 (3,072MB) | 218.50 | 147.75 | £450 | 0.33 | 254 | 0.58 | ||
| XFX Radeon HD 7950 BE DD (3,072MB) | 207.50 | 131.25 | £415 | 0.32 | 217 | 0.60 | ||
| AMD Radeon HD 7950 (3,072MB) | 187.30 | 100.95 | £350 | 0.29 | 207 | 0.49 | ||
| AMD Radeon HD 6970 (2,048MB) | 150.50 | 50.25 | £255 | 0.20 | 237 | 0.21 | ||
| AMD Radeon HD 6950 (2,048MB) | 133.70 | 32.40 | £185 | 0.18 | 194 | 0.17 | ||
| AMD Radeon HD 6870 (1,024MB) | 83.00 | 15.75 | £140 | 0.11 | 187 | 0.08 | ||
| NVIDIA GeForce GTX 590 (3,072MB) | 266.90 | 211.65 | £620 | 0.34 | 407 | 0.52 | ||
| NVIDIA GeForce GTX 580 (1,536MB) | 175.30 | 82.95 | £349 | 0.24 | 285 | 0.29 | ||
| NVIDIA GeForce GTX 570 (1,280MB) | 139.50 | 39.15 | £240 | 0.16 | 245 | 0.15 | ||
| NVIDIA GeForce GTX 560 Ti 448 (1,280MB) | 133.60 | 32.55 | £220 | 0.15 | 271 | 0.12 | ||
| NVIDIA GeForce GTX 560 Ti (1,024MB) | 96.40 | 18.00 | £170 | 0.11 | 225 | 0.08 | ||
1 the normalisation refers to taking playable frame rate into account. Should a card benchmark at over 60 frames per second in any one game, the extra fps count as half. Similarly, should a card benchmark lower, say at 40fps, we deduct half the difference from its average frame rate and the desired 60fps, giving it a HEXUS.bang4buck score of 30 marks. The minimum allowable frame rate is 20fps but that scores zero.
2 the HEXUS.bang4watt score is a crude measurement of how much normalised performance the GPU provides when evaluated against system-wide power-draw that's shown in the table: the former is divided by the latter. We're using the peak power-draw numbers obtained by running real-world Crysis 2.
Summary
The performance increases of around 10 per cent above a regular HD 7950 computes well in our bang4buck evaluation. The reason for this rests with the average frame-rates being pushed much closer to 60fps, which is the ideal, and thus the normalised FPS is much higher. Factor in the £415 asking price and the XFX card provides comparable value to the reference version.


